Add Key Metrics to Evaluate Your Business
Learning Objectives
After completing this unit, you’ll be able to:
- Explain when to use number widgets.
- Add a number widget to a dashboard.
Calculate Key Metrics to Measure the Success of Your Business
One of the key purposes of a dashboard is to give you quick insights into your business. That usually means providing key measurements of your business, such as the following:
- Total number of deals
- Average deal size
- Average case resolution time
- CSAT score
- Total opportunity value generated by a marketing campaign
Laura wants reps and their managers to know the value of opportunities currently in the pipeline, and how much was won as well as lost. The best way to represent those metrics is with number widgets.
Let’s create the following number widgets in our dashboard. 
We calculate the value for each widget based on the Amount field in the DTC Opportunity dataset. (This dataset comes with the Analytics Developer Edition org that you signed up for.) We apply different filters to get the total open, won, and lost opportunity amounts. For example, to get the total amount for only open opportunities, we have to filter out the opportunity records that are won or lost.
So where do we create these calculations? With queries. To learn about queries, check out the following video.
How Much Open Opportunity Is in the Pipeline?
Laura wants the dashboard to show the total value of open opportunities in the pipeline. Let’s show this metric in the first number widget.
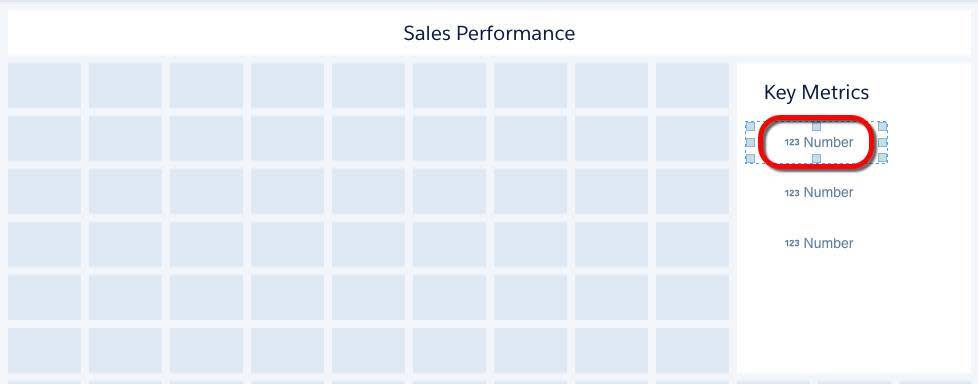
- While your Sales Performance dashboard is in edit mode (click the Edit button to put a dashboard in edit mode), hover over the top number widget and click in the center. This open the widget wizard that builds a query to calculate the value for this number widget.
- In the list of datasets, select DTC Opportunity. Note: If you get an error that says the data is unavailable, click Close the wizard and the Number widget again. This error happens if the dataset hasn’t been created yet. When you sign up for an Analytics DE org, this dataset is created for you. Sometimes you have to wait a couple of minutes. If no error occurs, the explorer opens, showing a visual representation of the query. The default query calculates the total number of records in the selected dataset.
 To show the total value of opportunities in the pipe instead, let’s modify this query. Since each row in the dataset represents an opportunity, add the opportunity amount of all the rows. To get that, let’s change the count of records to the sum of opportunity amounts.
- Click Count of Rows under Bar Length, and then select Sum | Amount.
- To show the amount for only open opportunities, let’s add a filter that excludes closed won and closed lost opportunities.
- Click Filters, click + under the Filters tab, and then select Stage. Note: Enter stage in the search box to quickly locate the field.
- Select all values, except 08 - Won and 09 - Lost.
- Click Apply.
- To label the query, click the pencil next to Untitled Query and enter Open Opp Amount. Note: Query labels are important because they help you identify the query when you want to apply it to a widget. It's suggested to add a label while creating the query because Analytics generates the ID based on the label. You can’t change the ID after creating the query, unless you edit the dashboard JSON. (Analytics uses IDs to identify queries behind the scenes in the dashboard JSON.)
- Click Done. Congrats! You created your first number widget. Unfortunately, you can’t see the widget title and some digits are truncated. Let’s fix these issues now by modifying the widget properties.

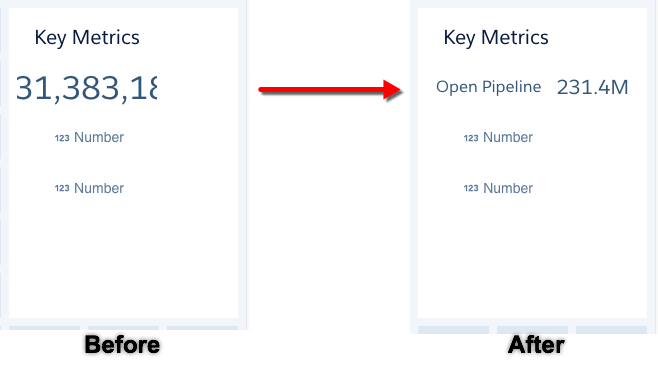
- Select the widget to show its widget properties and then change the Title property from Sum of Amount to Open Pipeline, select Shorten number, and increase the number size to 20 in the Text Style category.
 When you preview the dashboard, you can now view the new title and the shortened number inside the widget. Click the Preview button.
- Save the dashboard. As you can see below, our new title clearly indicates what the number represents and uses terminology that’s familiar to users viewing the dashboard. Nice work.
How Much Business Has Already Closed?
In addition to the Open Pipeline metric, you also want to show the total value of won opportunities. To save time creating the second metric, clone the Open Opp Amount query that you just created, and then change the filter.
- Select the Open Pipeline widget in the dashboard. The widget-level buttons appear at the bottom of the dashboard designer.

- To clone the query, click More Actions
 and then Duplicate Widget
 .
.
- Edit the duplicate query
 . Notice that the explorer retains the query. Let’s change the filter to show won opportunities instead of open opportunities in this cloned query.
- Click the Filters tab, and then click Stage filter.

- Remove all selections in the Stage filter, and then select only 08 - Closed Won.

- To apply the new filter, click Apply.
- To distinguish this query from the other one, set the label from Open Opp Amount to Won Opp Amount.
- To create the query, click Update. Excellent! Now it’s time to apply this new query to the second number widget.
- Drag the new Won Opp Amount query on top of the second number widget.
 Great. This widget now shows the total value of all won opportunities.
- Select the new widget and, in the widget properties, change the Title widget property to Won Opportunities, select Shorten number, and increase the number size to 20.
- While you’re at it, build the third number widget to show the lost opportunities. Select 09 - Lost as the stage filter, enter Lost Opp Amount as the label, change the widget title to Lost Opportunities, select Shorten number, and increase the number size to 20.
- Save the dashboard.
Take a bow! With the first two number widgets, you’ve just given Laura the ability to see how much money is in the pipeline and how much is in the bank. With the third, she knows how much money was lost to competitors. Don’t worry that some of the titles are truncated while editing the dashboard. When you preview it, you can see the complete titles.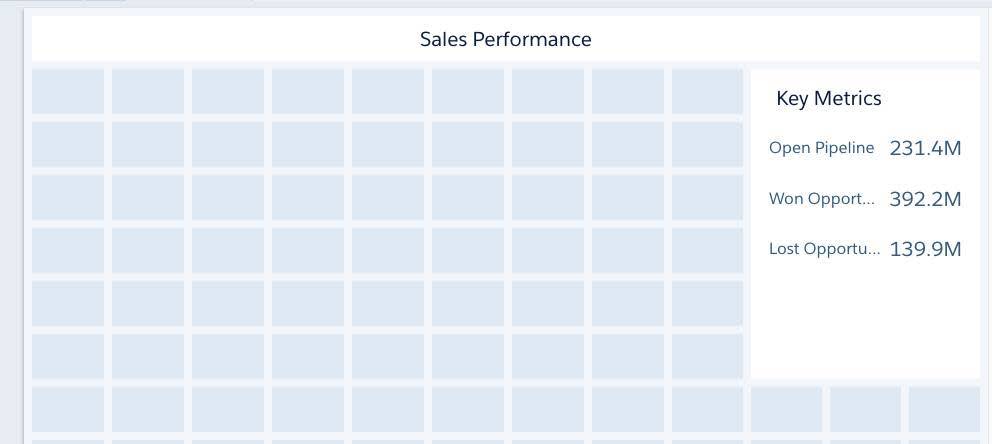
In the next unit, you create a chart that helps Laura compare sales reps and a table that lets her see their individual opportunities.
Resources