Explore What Tableau Server End Users Can Do
Learning Objectives
After completing this unit, you’ll be able to:
- Connect to your data sources.
- Create visualizations in the browser.
- Publish workbooks and data sources to Tableau Server.
- Share and collaborate on the web.
Who Else Is Tableau Server For?
If you’re not a server or site admin, you might be one of the following:
- A business analyst with a Creator license who creates visualizations
- A sales manager with an Explorer license who interacts with and edits existing workbooks
- An executive with a Viewer license who reviews dashboards created by others at your organization
What you can do on a Tableau Server site varies depending on your license type, site role, and content permissions.
Let’s assume you’re a non-admin with a Creator license and can connect to data sources, author visualizations, and publish your findings for others in your organization.
Connect to Data on Tableau Server
Before you start creating a visualization on Tableau Server, you must first connect to your data.
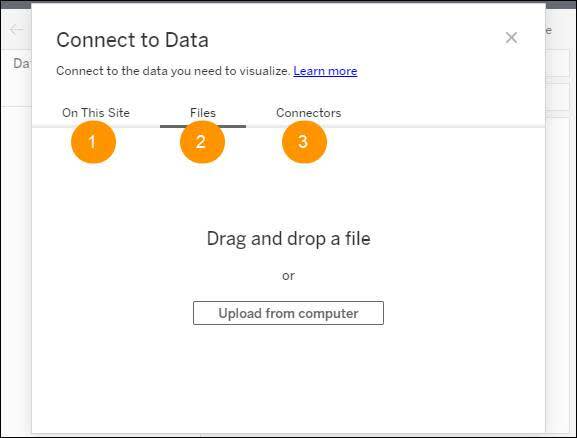
You have a few options.
- Select On This Site to browse or search for published data sources.
- Select Files to upload Excel or text-based data sources (.xlsx, .csv, .tsv) directly in your browser.
- Select Connectors to connect to data housed in a cloud database or on a server in your enterprise. There are dozens of connectors, including Amazon Redshift, Dropbox, Google Drive, Microsoft SQL Server, and many more.

Create Visualizations on Tableau Server
Once you’re connected to your data, you can start authoring views right in your browser.
To create a visualization, simply drag a field from the Data pane into the view, or onto a card or shelf.
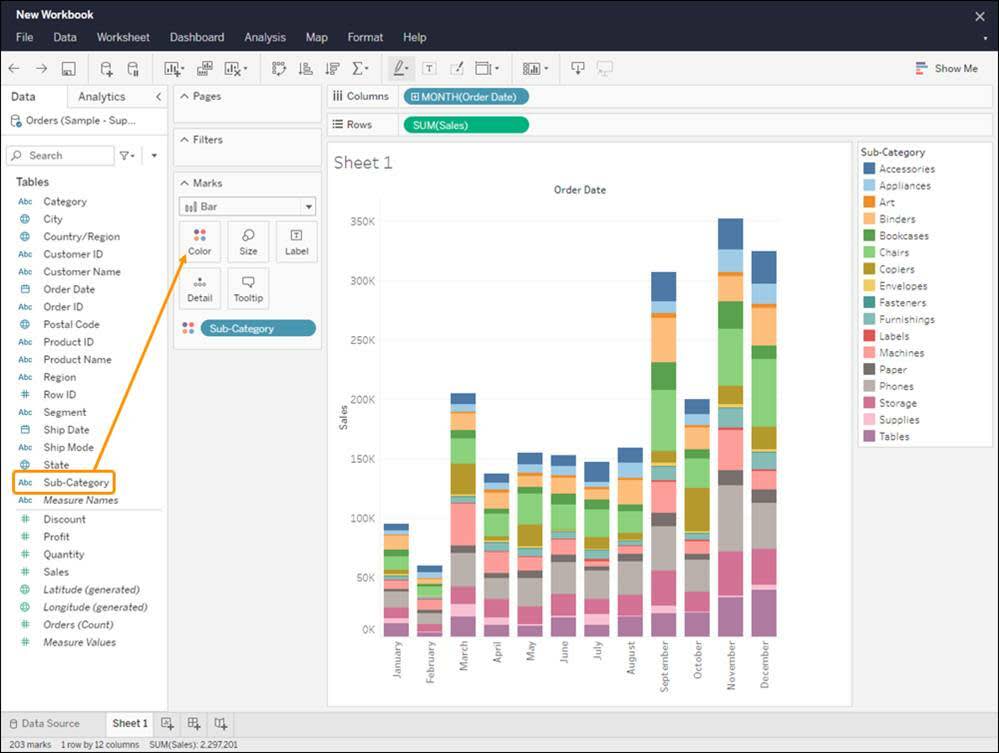
As you work, you’ll immediately see the view update with charts, tables, text, and more.
To learn more about web authoring in Tableau, check out the trail, Get Started with Web Authoring in Tableau Cloud.
If you don’t want to create a visualization from scratch, you can also edit an existing workbook or a copy of one.
Saving Workbooks and Data Sources to Your Site
Tableau Server enables everyone in your organization who has a license to view a viz to see and understand data. But for others to view your content, interact with it, and edit it (if their permissions allow), you need to actually save, or publish, your content to the web.
Publish Workbooks
When creating a visualization on the web, you can save your work at any time by selecting File | Save. To save a copy of an existing workbook, select Save As instead. And if you want to add a workbook that’s not on your Tableau Server site yet, you can upload it by selecting New | Workbook Upload from either the Home or Explore page.
Publish Data Sources
With the right permissions, you can also publish data sources to Tableau Server. This is essential for maintaining a single source for your data. It also facilitates collaboration since others can use your published data sources to build their own workbooks.
To publish a data source using web authoring, open the workbook that’s connected to it. Then from the Data pane, click the dropdown menu for the data source and select Save As Published Data Source.
Share and Collaborate on Tableau Server
OK, so now you know how to connect to data, build a visualization, and publish workbooks and data sources on your Tableau Server site. But why put content on your site, anyway?
Share Content
Well, one reason is so you can share your work with others. You can share projects (discussed in the previous unit), views (another name for a single visualization within a workbook), workbooks (which may contain multiple visualizations), data sources, metrics, and flows. This includes sharing with users directly, obtaining a link to the content that can be passed around, and using an embed code for putting the content on an external website.
Subscribe to Content
You can also create subscriptions to views and workbooks. Subscribers will receive regular emails with a snapshot of the visualization right in the message.
Create Alerts
One other thing you can do is create data-driven alerts to be notified if the underlying data in a visualization reaches specific thresholds.
There’s so much more, but these are just a few of the things Tableau Server end users can do.
Now you know how server admins, site admins, and other Tableau Server users can help you and your organization see and understand data.
Resources
- Video: Getting Started with Tableau Server tutorial (Sign-up required)
- Tableau Help: Creators: Connect to Data on the Web
- Tableau Help: Create, Interact with, and Embed Views on the Web
- Trailhead: Get Started with Web Authoring in Tableau Cloud
- Tableau Help: Best Practices for Published Data Sources
- Tableau Help: What Can I Do with a Tableau Site?
- Tableau Help: Share and Collaborate on the Web