Evaluate Account Insights and Trends
Learning Objectives
After completing this unit, you’ll be able to:
- Analyze data on the Account Insights dashboard.
- Track the orders and products for the accounts you manage.
Analyze Sales Agreements
Now that Vance knows which account needs work, he can analyze it further. He opens the Account Insights dashboard from the Key Account Manager dashboard on his homepage to find out more about Meridian Partners. This dashboard helps Vance get a 360-degree view of each account.
He opens the Agreements Performance tab. When he sets the global filter for Parent Account Name to Meridian Partners, he gets useful highlights of the account, such as share of revenue contribution, pending sales agreement approvals, upcoming renewal count, and CLV.
Vance has heard about CRM Analytics’s revenue projection from Elliott and other colleagues and is keen to try it out. He sets the global filter for Time Period to All Time and toggles the Revenue Projection On. Revenue projection looks at an account’s historical data and projects future revenue visually.

Vance can see the maximum and minimum confidence interval lines and the month-over-month actuals. This helps him understand whether he’ll be able to meet his planned target at his current business rate. The cumulative actuals are a lot closer to the minimum confidence interval line, which means that Meridian Partners is underperforming and won't meet its targets.
He quickly notes some critical numbers that he can share with Meridian Partners in an upcoming call.
- The planned revenue trend shows a major surge while the actual revenue has dwindled, making the gap between them more prominent.

- The revenue realization stands at 54% to date but only four monthly schedules have contributed to a 100% realization. For most monthly schedules, the number is below 50%.
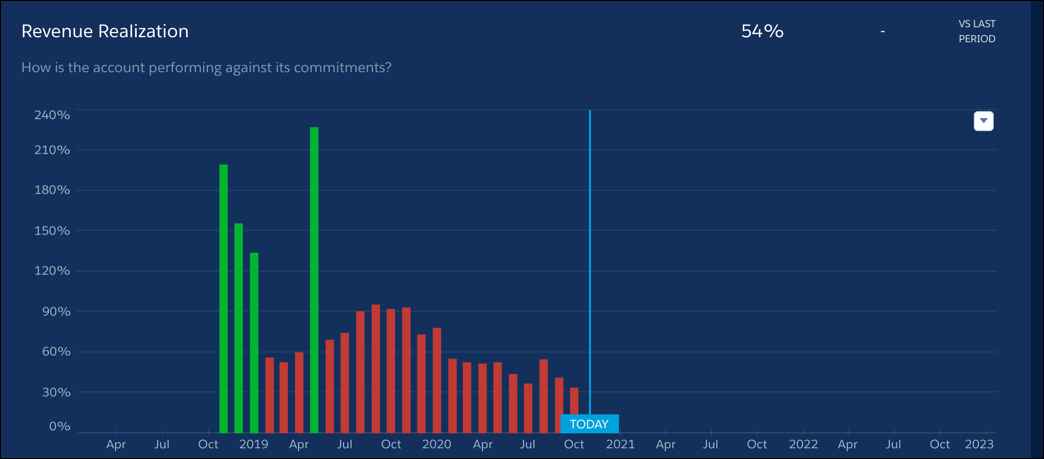
- The actual-versus-planned revenue difference for the account is 46%. The actual revenue is significantly less than the planned one in future months.

Based on the analysis, Vance realizes that he needs to follow up on the order inflow for Meridian Partners and plan for lesser quantities in future schedules. It’s something he can keep in mind while renewing agreements too. But before taking any action, he must find out which product has the least demand and where Meridian Partners failed to comply.
Products, Pricing, and Performance
On the Product Sales & Pricing tab, Vance takes a look at all the 20 products sold to Meridian Partners and their revenue contribution over time.
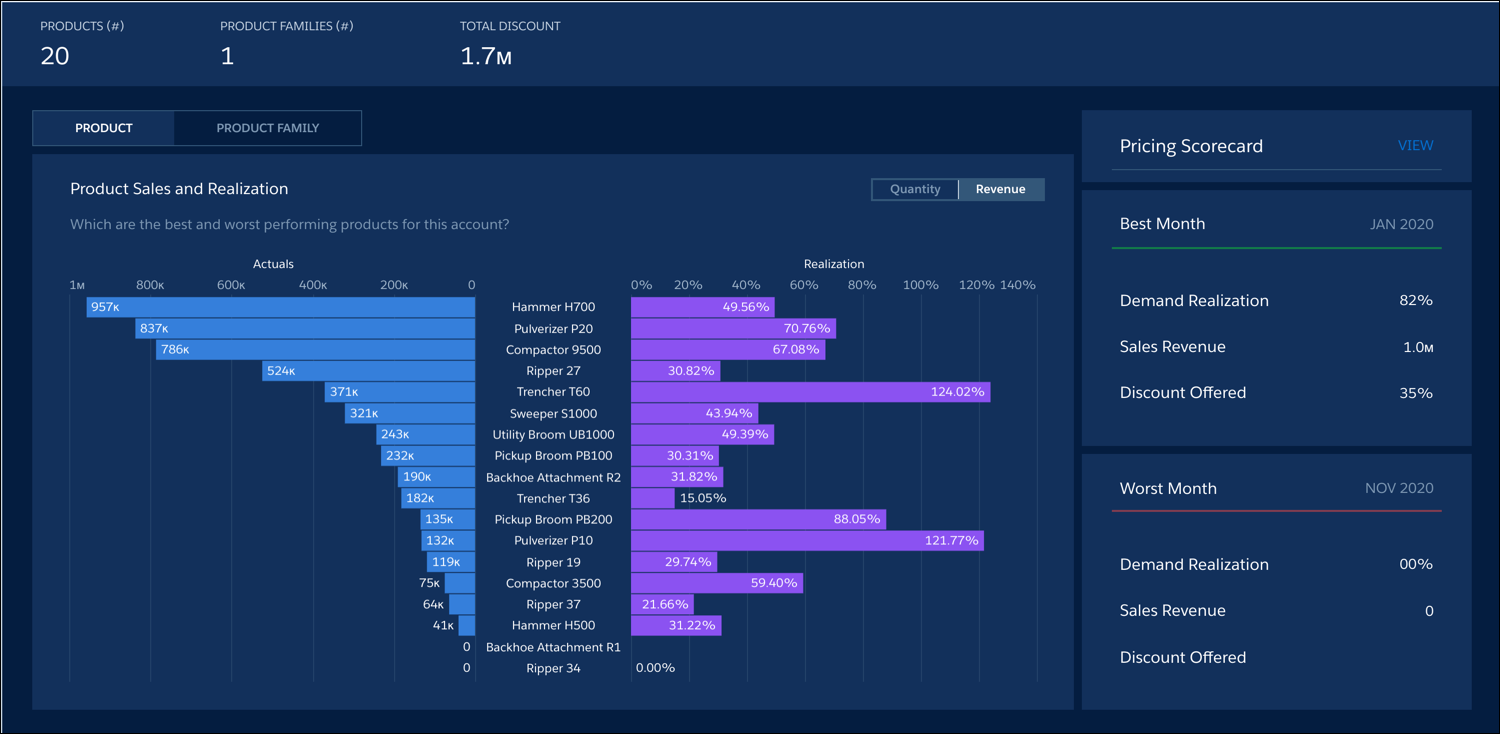
The tab shows the best and worst monthly schedules from the perspective of sales agreements. On the Pricing Scorecard, Vance clicks on the product bar in the graph to check the average, maximum, and minimum price of each product.
Vance investigates two products that stand out.
- Pulverizer P10 has one of the largest actual versus realization difference but it’s a positive one. Even in the month of May when it had the lowest performance, the revenue realization was 89%, which shows how successful the product has been.
- Hammer H500 is contributing the least to the revenue share for this account. June of the current fiscal year has been the worst month for this product where not a single penny was earned from sales.

At the bottom of the Product Sales & Pricing tab in the Details tab, there are a few numbers to note. In the current fiscal year, there are two sales agreements with Meridian Partners where Hammer H500 has been sold, but the entire revenue has been realized from only one agreement.

Vance wants to look at the composition of products that make up the orders of Meridian Partners. If he can see the number of orders for all the products and compare them, he can get a good idea of the pipeline and expected revenue.
Check the Status of Your Orders
The Order Status tab helps Vance drill down into each order fulfillment line and specific product requests. He can estimate the status of each order and whether there are payments pending for any of them. Vance can see the number of order lines per week, based on the order start date.

Here’s the information he collects: The total order value is $5.8 million. The highest contribution to product sales revenue for Meridian Partners is from Hammer H700 orders, while the lowest contribution is from Hammer H500.
To gather more details about Hammer H500, he clicks the bar above its name. In the Details table, he sees that the orders are associated with the sales agreement Meridian Partners SA_Monthly18_2018-11-03.

Look at the Sales Forecast
Account managers look at the sales forecast of accounts in two different ways. At the start of an adjustment period, monthly or quarterly, they look at the composition of a forecast to plan their numbers better for upcoming schedules. And during the year, they look at forecast performance to analyze how accurate the forecasts have been. The Sales Forecast tab on the Account Insights dashboard provides both views.
On the Performance view of the Sales Forecast tab, Vance can see the month-on-month forecast revenue or quantity gap for Hammer H500. The revenue attainment is a meager 35%, which isn’t healthy.

On the Composition tab, Vance can check product-wise forecasts. He can look at how sales agreements, orders, and opportunities make up the forecast numbers of Meridian Partners. This would come in handy when he meets Elliott next month to adjust the account’s forecast.

Now that Vance and Elliott have figured out the trends and patterns of their accounts, it’s time to look at the accounts’ product composition. The demand patterns and sales of these products will provide them further insights into how to improve business.