Monitor Agent Health
Learning Objectives
After completing this unit, you'll be able to:
- Explain the value of proactive, automated health monitoring for AI agents.
- Create alerts with practical thresholds for standard metrics and custom scores.
- Investigate alert notifications by drilling into associated sessions and conversations.
- Use findings from alerts to prioritize and implement targeted agent improvements.
Alex Wu has already used Agent Analytics and Sessions & Intents to improve the Excursion Booking agent at Coral Cloud Resorts. Deflection rates are up, and escalations are down. But as usage keeps climbing, Alex knows that point-in-time analysis is no longer enough.
He now needs an early-warning system that can flag performance problems before guests notice them. That means moving from reactive troubleshooting to proactive health monitoring.
Why Monitor Agent Health Proactively?
As AI agents handle more real customer traffic, failures can spread quickly. A latency spike during peak booking hours can increase abandonment in minutes. A sudden jump in errors can affect multiple subagents before anyone opens a dashboard.
Agent Health Monitoring helps teams detect these silent failures in near real time so they can act fast.
With health monitoring in place, Alex and his team can:
- Catch emerging issues before they become guest-facing incidents.
- Reduce mean time to detection by using automated notifications.
- Focus investigations on the exact sessions that triggered concern.
- Prioritize fixes using measurable signals instead of assumptions.
- Build confidence that the agent stays within acceptable service levels over time.
This workflow supports the monitor phase of the agent development lifecycle (ADLC): observe, investigate, improve, and then monitor again.
Set Up Alerting for Agent Health
Alex opens Agentforce Studio and navigates to Observe & Optimize to configure alerts for the Excursion Booking agent.
From there, he can monitor both:
-
Standard metrics, such as error rate and interaction duration (latency)
-
Custom metrics, such as a resort guest user satisfaction rate that’s based on a custom user sentiment score
What an Alert Includes
Each alert is tied to:
- A selected standard or custom metric
- A specific AI agent
- A threshold condition (for example, at or above, or at or below)
- A threshold value that represents the boundary of acceptable performance
When monitored data breaches the threshold, the system sends a notification so Alex can investigate quickly.
Start with Baselines, Then Set Thresholds
Alex doesn't pick threshold values at random. He uses a repeatable process.
- Review at least 30 days of historical data for the selected metric.
- Identify the normal operating range.
- Define what is acceptable for guest experience with business stakeholders.
- Set a threshold where normal variation ends and action should begin.
- Revisit and tune the threshold as agent behavior changes.
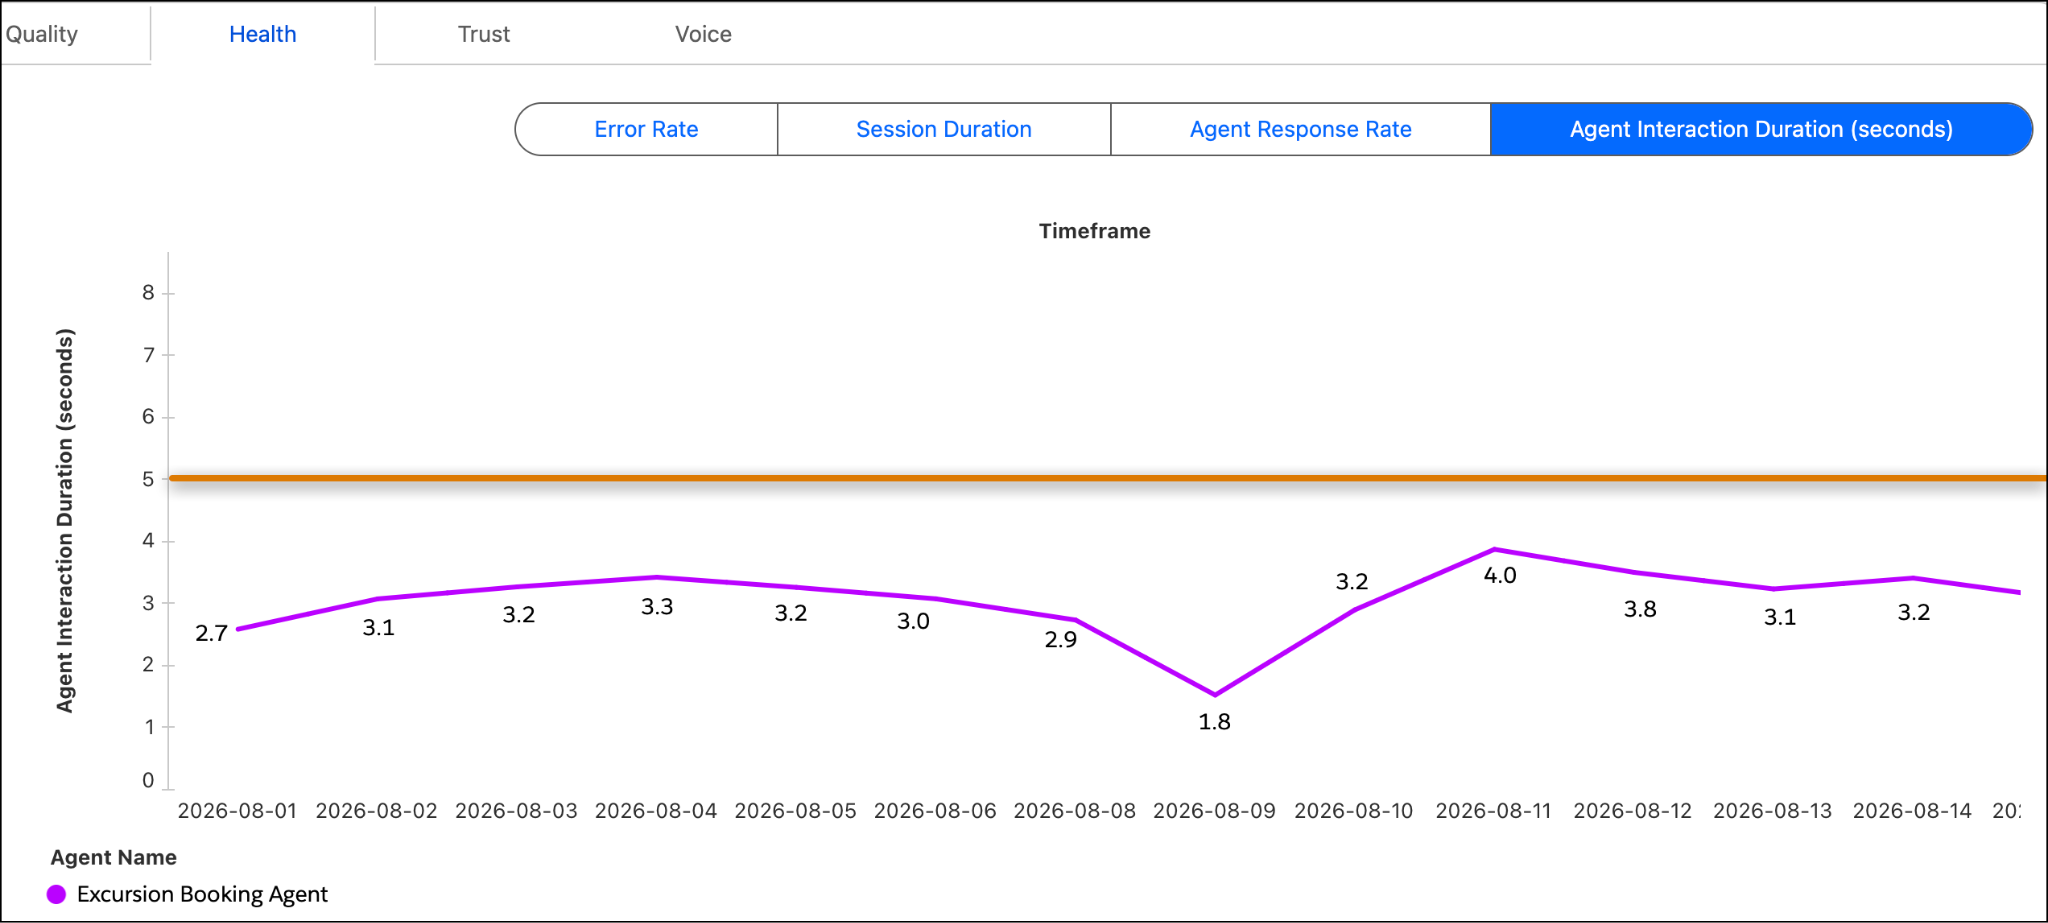
For example, if the Excursion Booking agent’s interaction duration usually ranges from 1.8 to 4.6 seconds, and guest services reports that delays above 5 seconds feel disruptive, Alex can set an alert threshold at 5 seconds (at or above), as shown in the orange horizontal line.
He repeats this logic for other health-sensitive measures. The result is a practical alert set that reduces noise while still surfacing meaningful risk.
Example Alert Plan for Alex
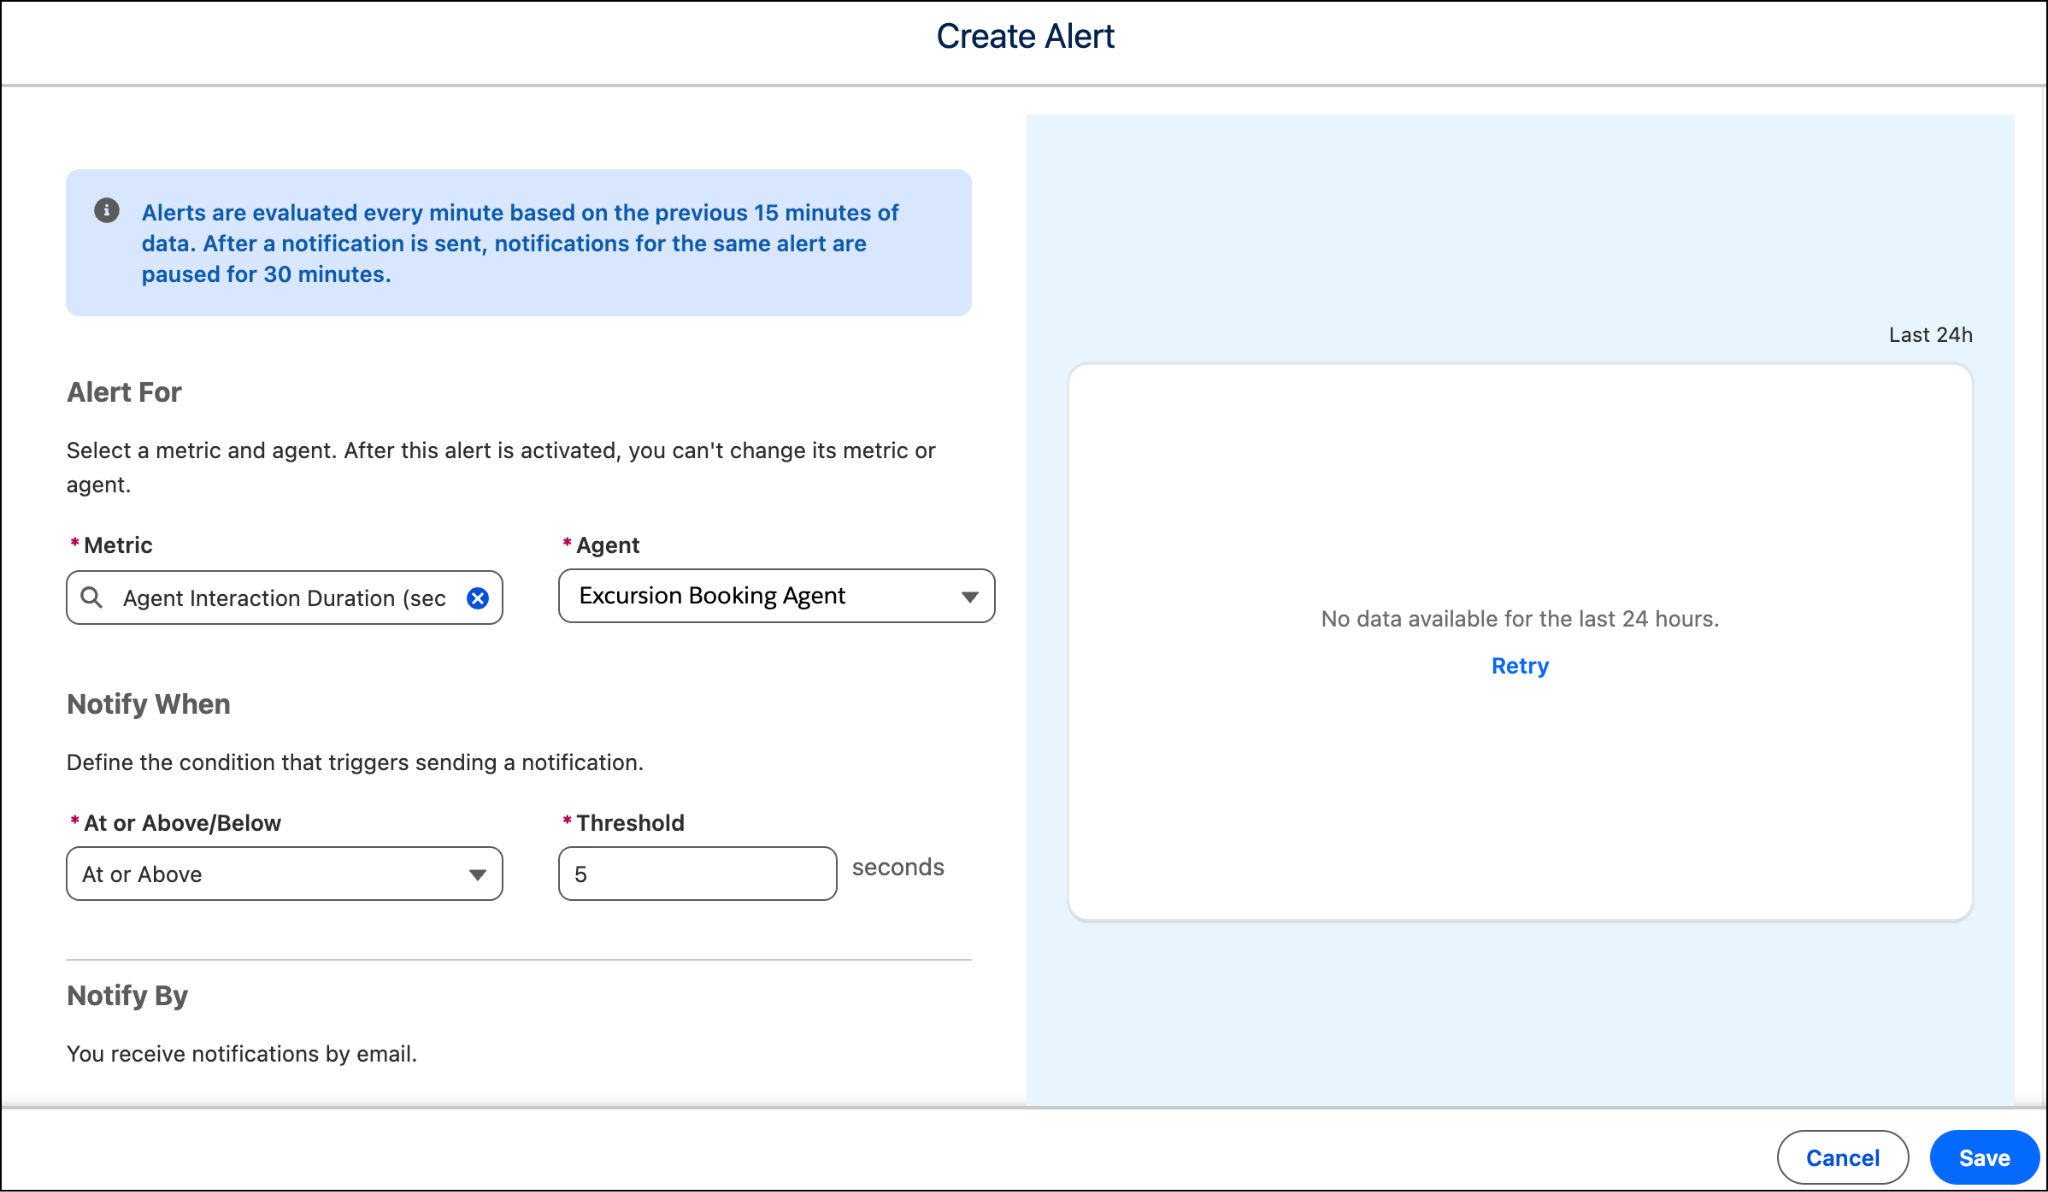
Alex creates two starter alerts.
-
Agent Interaction Duration: Triggers when average interaction duration exceeds his service target.
-
Elevated Error Rate: Triggers when response processing errors rise above normal range.
Together, these alerts cover speed and reliability.
Investigate Notifications and Find Root Cause Fast
Two weeks later, Alex gets an alert notification: Agent Interaction Duration exceeded threshold for the Excursion Booking agent.
He follows a simple investigation path.
Step 1: Open the Notification
In Observe & Optimize | Alerts, Alex opens the notification list, which arrived via email or an in-app notification. For Metric, he filters by Agent Interaction Duration.
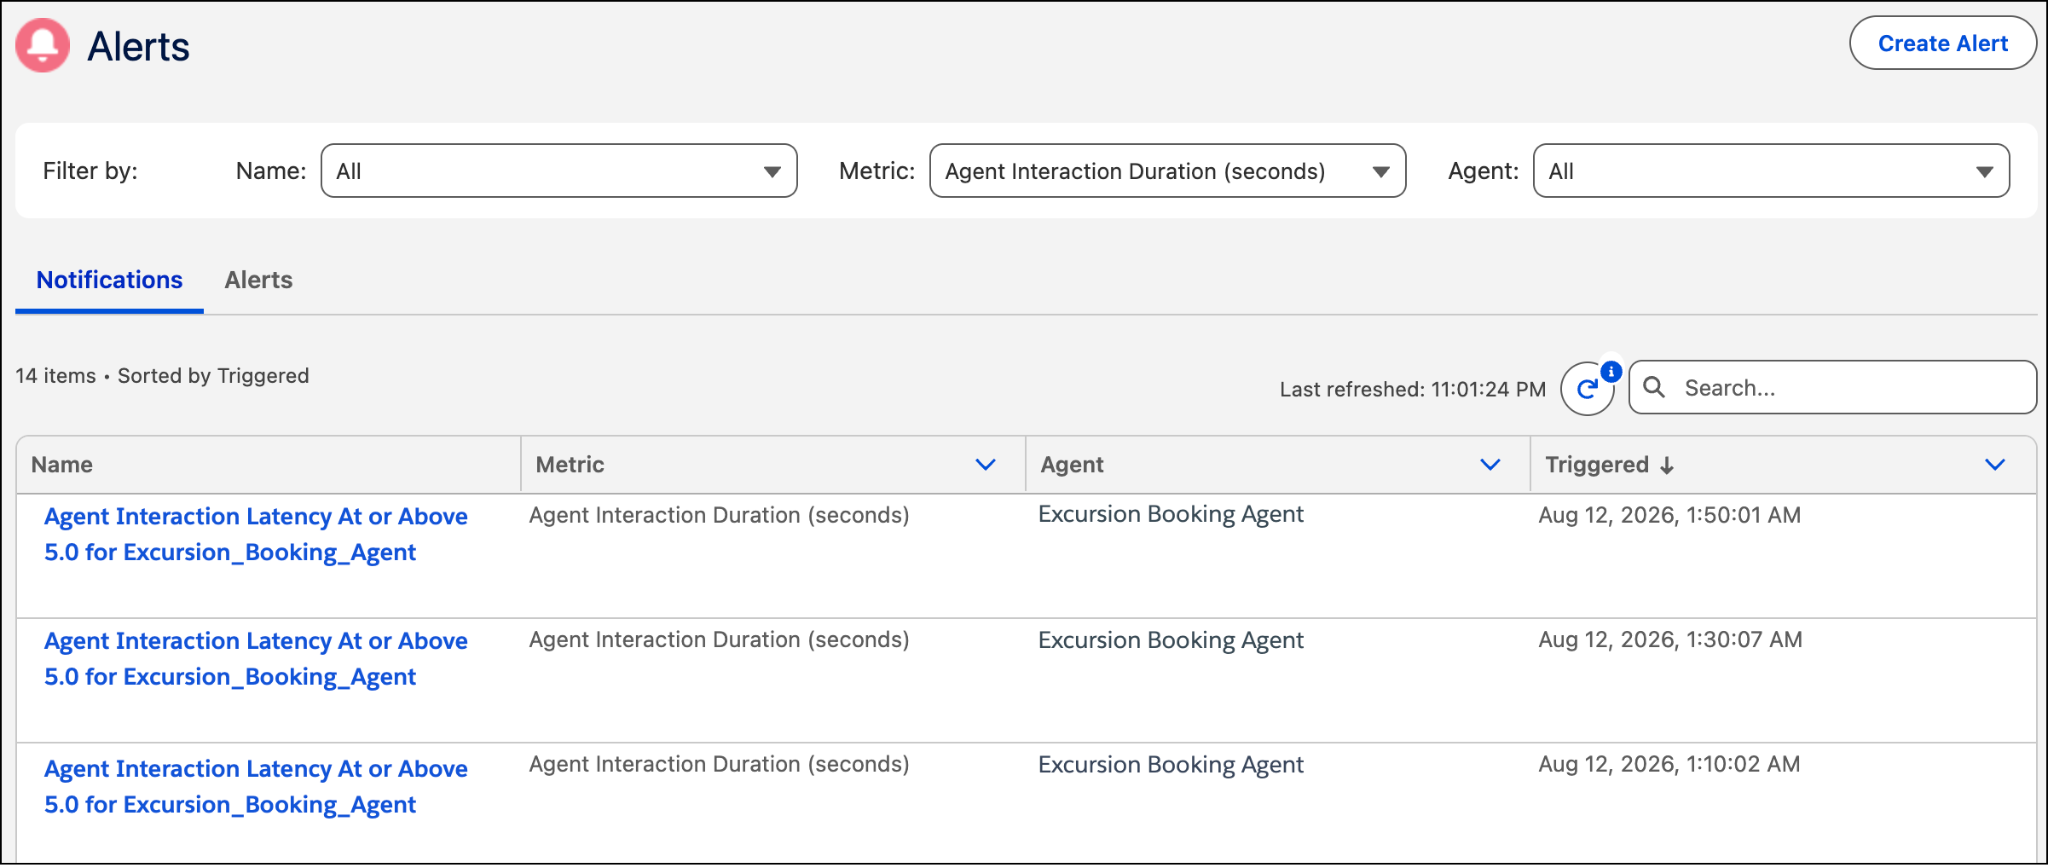
Each notification provides key context.
- Alert name
- Metric or score involved
- Agent
- Trigger timestamp
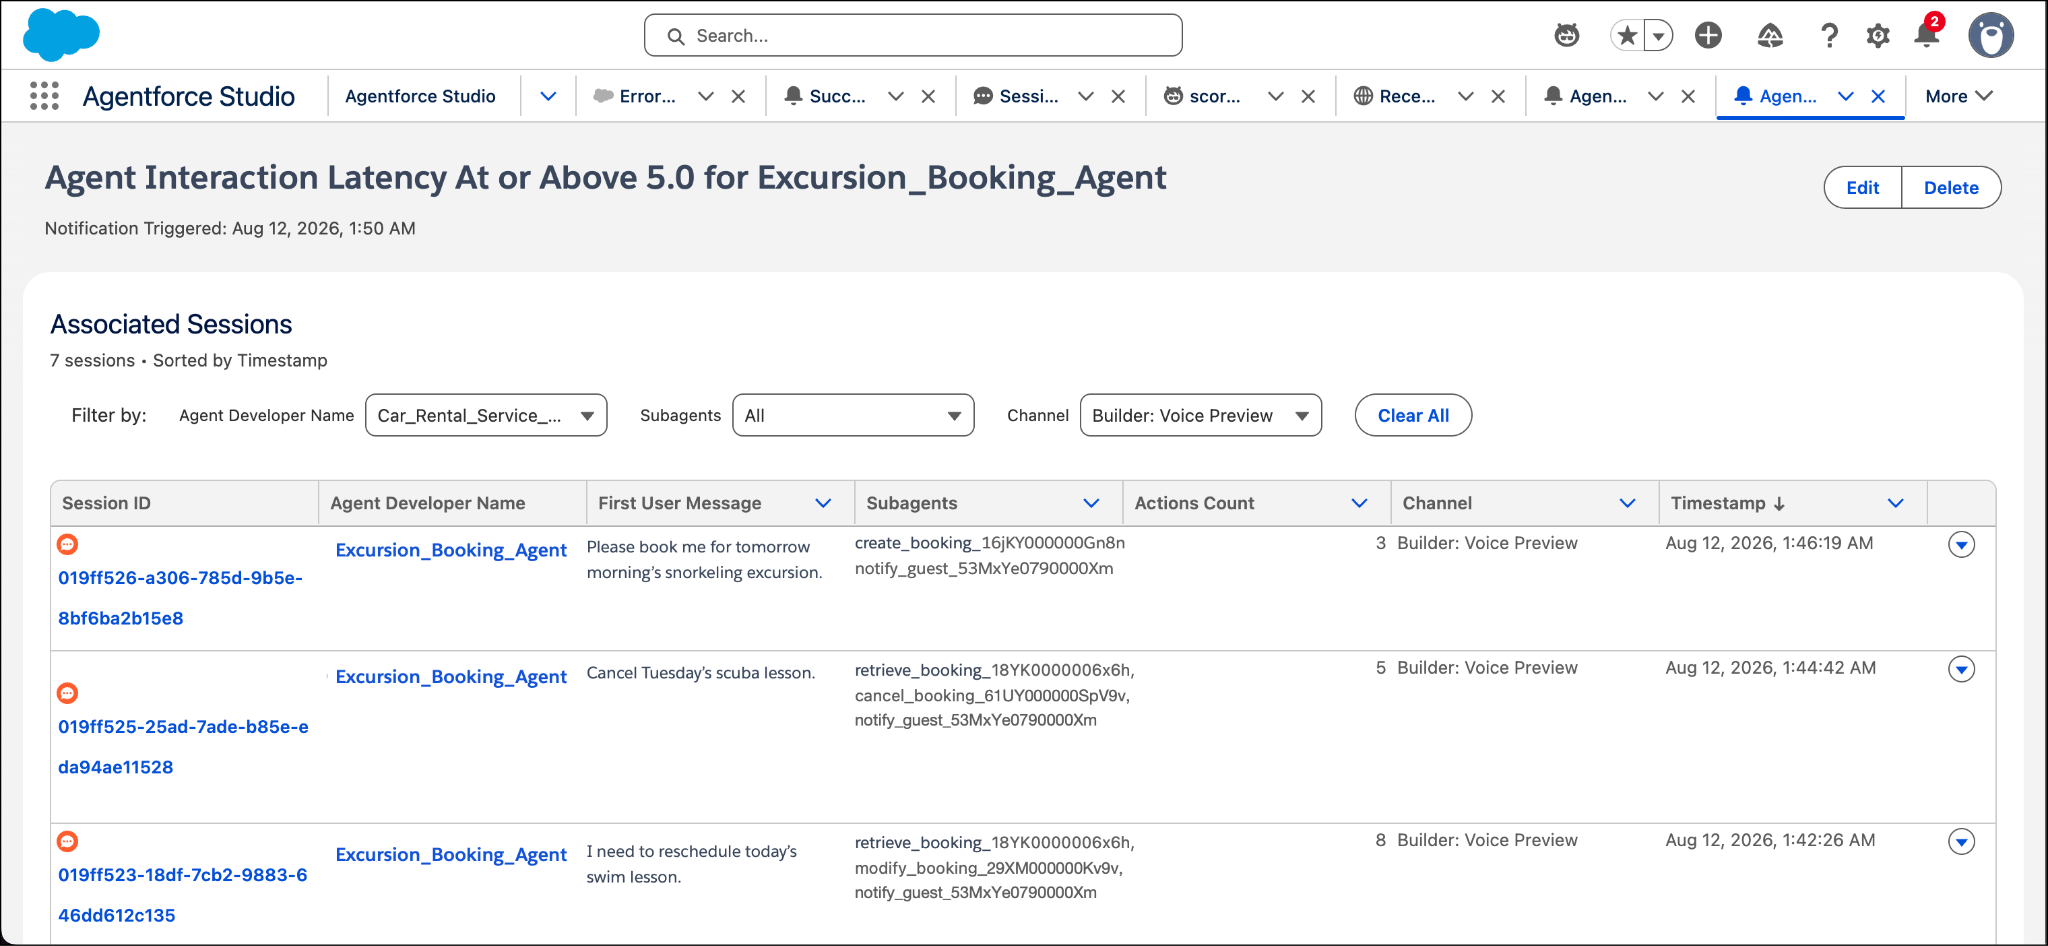
He then selects the triggered alert he wants to investigate. This immediately narrows his scope to the interactions linked to the alert condition.
Step 2: Drill into Associated Sessions
Alex scans for patterns across session rows, such as:
- Repeated subagent involvement
- Similar user intents
- Shared session outcomes (for example, abandonment or escalation)
- Time clustering that suggests incident windows
Step 3: Open Individual Conversations
Alex opens several session IDs and reviews the conversation flow.
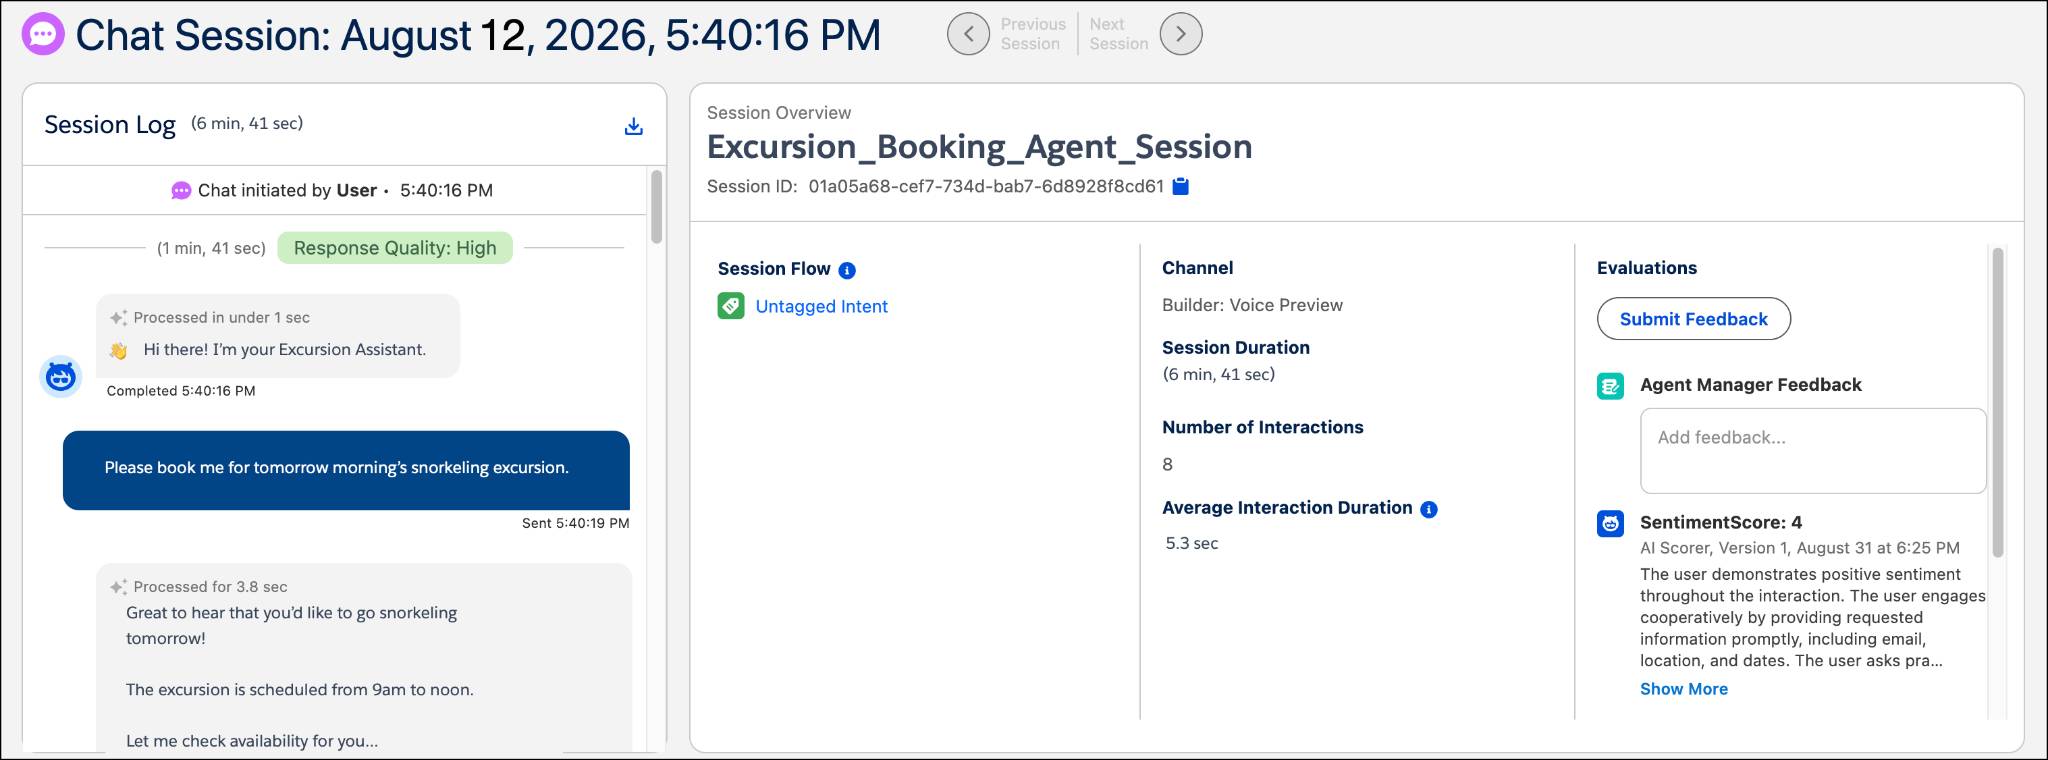
On each session page, he checks:
- Turn-by-turn exchange between guest and AI agent
- Agent response timing
- Trace details for where processing slowed down or failed
- Subagent routing and Agent action execution patterns
This lets him separate symptoms from causes.
From Alert to Action
The latency alert is concentrated in sessions that involve the Water Activities Booking subagent, especially during weekend spikes.
By reviewing conversations and traces, Alex finds a repeatable pattern.
- Guests ask for availability and pricing in one request.
- The subagent invokes multiple Agent actions in sequence.
- One retrieval step often times out, delaying the full response.
- Delays lead to drop-offs before booking is completed.
Alex now has enough evidence to prioritize fixes.
- Simplify the subagent's decision path for combined availability-plus-pricing requests.
- Update instructions so the subagent asks one clarifying question before triggering multiple actions.
- Add fallback behavior when retrieval latency crosses an internal limit.
- Retest the updated behavior in Agentforce Testing Center, deploy, and continue monitoring.
After deployment, Alex watches the same latency and abandonment alerts. Over the next few weeks, notifications decrease, response times stabilize, and weekend booking completion improves.
That's proactive observability in practice: detect early, investigate quickly, improve continuously.
Best Practices for Health Monitoring
- Start with a small, high-value alert set and expand gradually.
- Use historical data plus business thresholds, not guesses.
- Review alert signal quality often; tune thresholds to reduce noisy notifications.
- Pair each alert with a clear owner and response playbook.
- Investigate sessions and conversations before changing Prompt templates, subagents, or Agent actions.
- Track post-fix metrics to validate that changes improved outcomes.
Wrap Up
You learned how to monitor AI agent health proactively with automated alerts, threshold-based detection, and focused investigation workflows. You saw how Alex Wu used notifications to pinpoint problematic sessions, drill into conversation-level behavior, and implement targeted improvements that reduced customer impact.
With Agent Health Monitoring, you can move from reactive debugging to continuous, data-driven reliability management for your AI agents.