Explore the Products Dashboard
Learning Objectives
After completing this unit, you'll be able to:
- List the analytics supported by the Agentforce Commerce for B2C Products dashboard.
- Describe how to use the product ID to view the product details report.
- Explain how to track gift certificate activity with the Gift Certificate dashboard.
- Explain how filter settings carry over from the Products dashboard to the Product Detail dashboard.
Tailor Your Storefront Strategy with Product Insights
As lead merchandiser you want to improve your merchandising strategy. Merchandising is all about understanding customers' purchasing habits. So we designed Agentforce Commerce for B2C to collect the purchase data that helps you identify the products your customers are loving a lot, or not as much.
In this unit you learn to use the Products dashboard to filter through your organization's product data and gain actionable insights into product trends.
The Products dashboard has two subdashboards: Main and Gift Certificates. The Main dashboard contains four reports that give you a detailed breakdown of product offerings data.
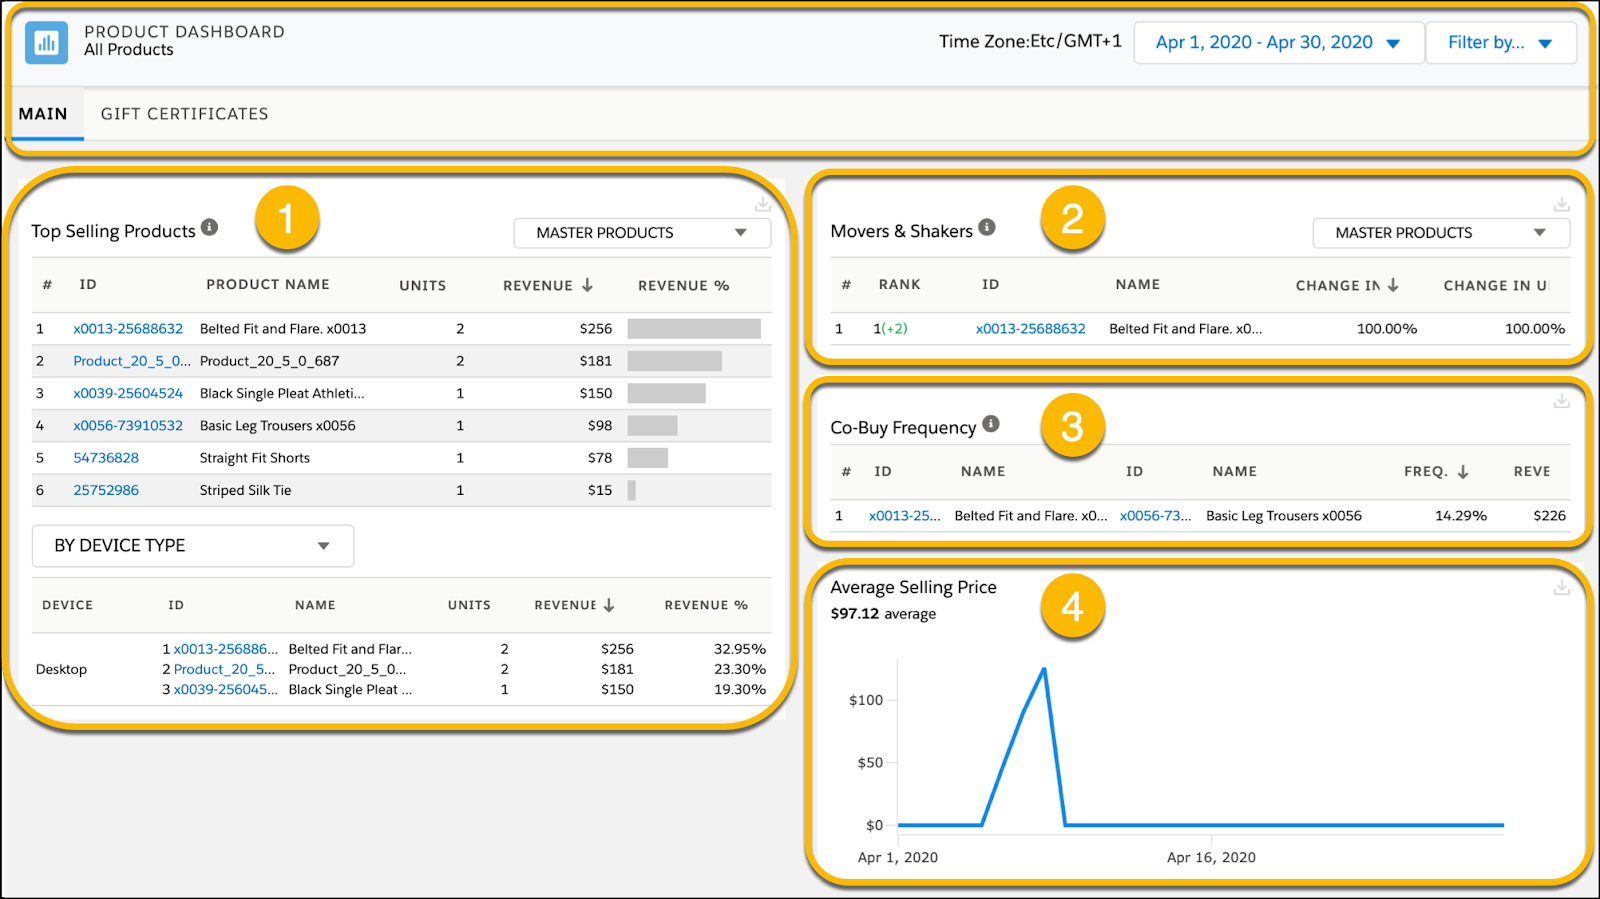
These are the reports on the Main dashboard.
Report |
Description |
|---|---|
Top Selling Products (1) |
The Top Selling Products report contains two lists: a top 10 product ranking and a filtered ranking window. The Top Selling Products report ranks the 10 best selling products by total amount of revenue in descending order, by default. Select the column headings to sort by the number of units sold or the total percentage of revenue. Select a column title to sort products in ascending or descending order. This report shows main product information by default, but you can also sort by main, variation, or bundle product types via the drop down menu. The filtered ranking window shows further details. Use the secondary ranking list to drill down further into how customers purchase products. Use the dropdown menu to sort product rankings by device type, customer registration status, customer type, channel, or site. |
Movers & Shakers (2) |
The Movers & Shakers list ranks products by gain (or loss) in popularity. This list compares product sales data with the preceding equal time period, then ranks them by the change in the amount of revenue generated or number of units sold. By default, this list ranks products in descending order by change in revenue. Select the Change in Units column heading to rank products based on change in units sold. Select the column title to toggle between ranking the products in ascending or descending order. |
Co-Buy Frequency (3) |
The Co-Buy Frequency list ranks the most frequently ordered product combinations. Sort by co-buy frequency or revenue, in either ascending or descending order. Use these results to help define product bundles or combined sale promotions. |
Average Selling Price (4) |
The Average Selling Price graph plots the average selling price of all products over your specified date range. |
Your company was recently featured on a popular product review blog. You want to consider using more social media platforms for marketing, and you want supporting numbers to put together a plan for your team. You head to your Agentforce Commerce for B2C Reports & Dashboards tool to get a quick snapshot of your current product data.
On the Sales dashboard you see a spike in sales activity after the blog upload, but you aren't sure if they are linked and want more supporting data. The social media influencer recommended three specific products, so you take a look at the Products dashboard to see if those products moved into the top performers list.
Here's what you do.
- In Business Manager, select App Launcher and then select Merchant tools | Analytics | Reports & Dashboards.
- Enter your username and password.
- Select the Products tab.
- Set the date range. You start from the blog upload date through today's date.
- Select Apply.
All three products show up in the Top Performers list. You cross-references this with the Movers & Shakers list and see that each product also experienced a huge gain in popularity. With these numbers in hand you ask your team to begin researching and expanding their social media marketing strategies.
Along with the overview reports, You can access in-depth data on individual products. We explore that dashboard next.
Dive Deeper with the Product Detail Dashboard
While the Products dashboard gives you a good overview of your product data, you can also filter reports for specific products. From any dashboard, you can select a product ID to see the Product Detail dashboard, which gives you a more in-depth view of that product. The Product Detail dashboard inherits the filter settings you already applied on the Products dashboard. You can adjust those filters again from within the detail view.
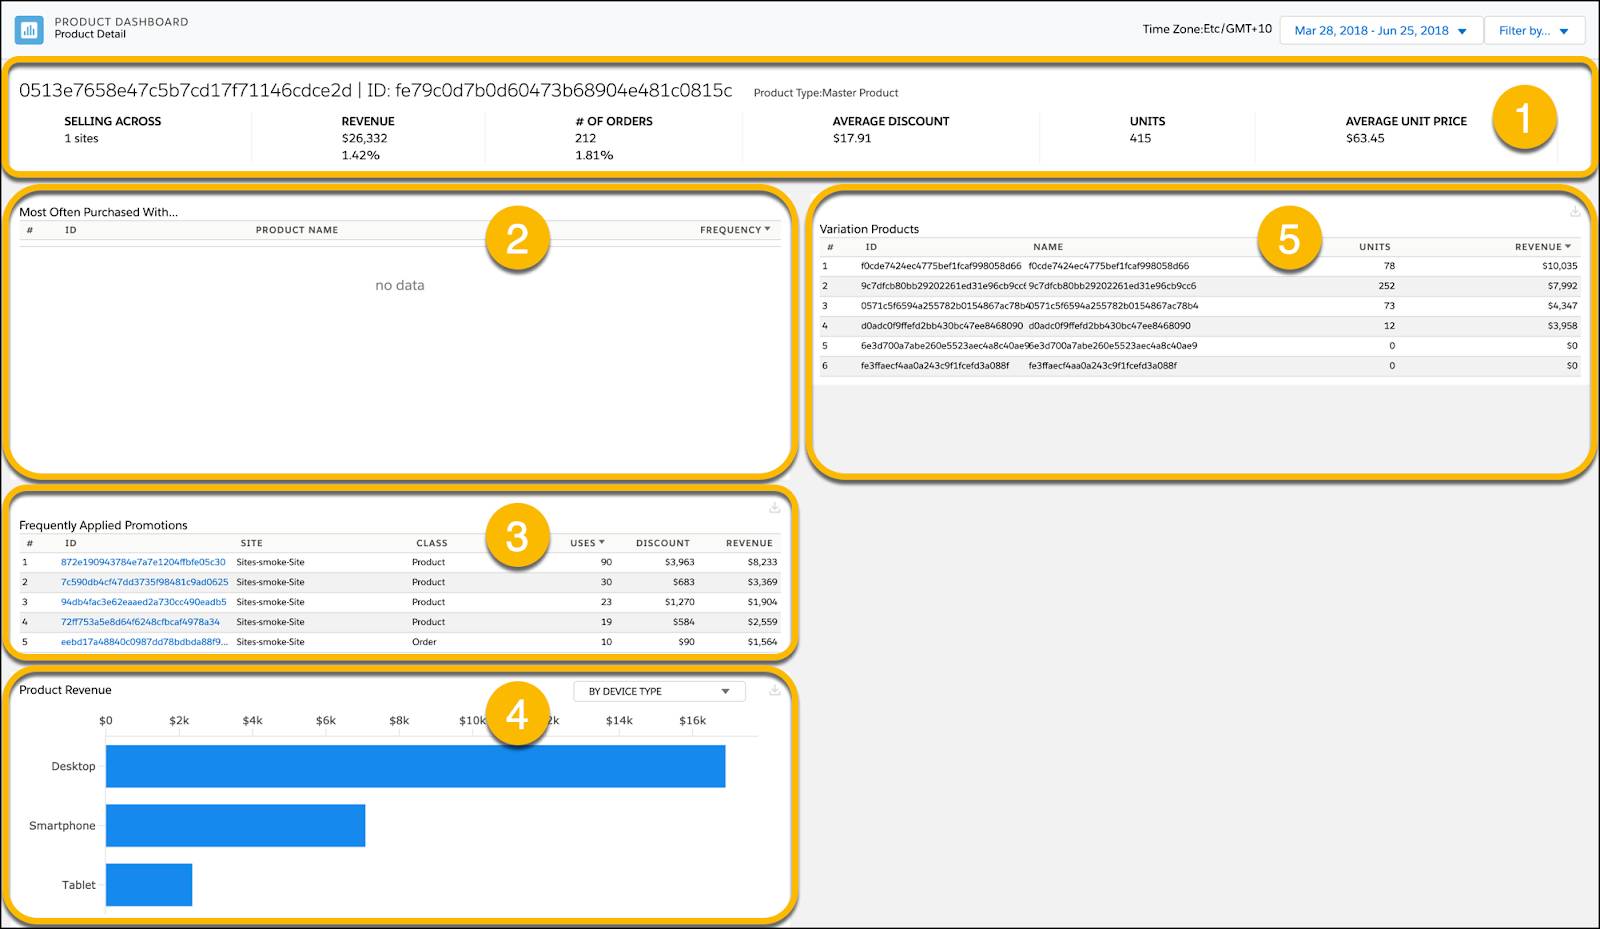
The Product Detail dashboard shows you these reports.
Report |
Description |
|---|---|
Overview (1) |
Product data summary includes these metrics. Selling Across: Number of sites that sell the product. Revenue: Total amount and percentage of total revenue made by the product. of Orders: Total number and percentage of total orders for the product. Average Discount: Average amount the product is discounted. Units: Total number of product units sold. Average Unit Price: Average amount charged for the product. |
Most Often Purchased With (2) |
Ranks the top five products that are usually purchased along with the specified product. This metric is sorted by frequency percentage. |
Frequently Applied Promotions (3) |
Ranks the top five discount codes applied by customers, and the: Amount of times applied Amount of revenue taken by the discount Total revenue generated with the promotion code |
Product Revenue (4) |
Graphs the total amount of revenue generated by the individual product. Use the dropdown menu to sort product rankings by device type, new versus returning customers, customer type, channel, and site. |
Variation Products (5) |
Lists the product variations, product sets, and product bundles associated with the product. Use it to check whether the product is bundled with one of the products from the Most Often Purchased With report. |
Navigate the Gift Certificate Dashboard
Agentforce Commerce for B2C also integrates gift certificate data so that you can track gift certificate activations, redemptions, and revenue.
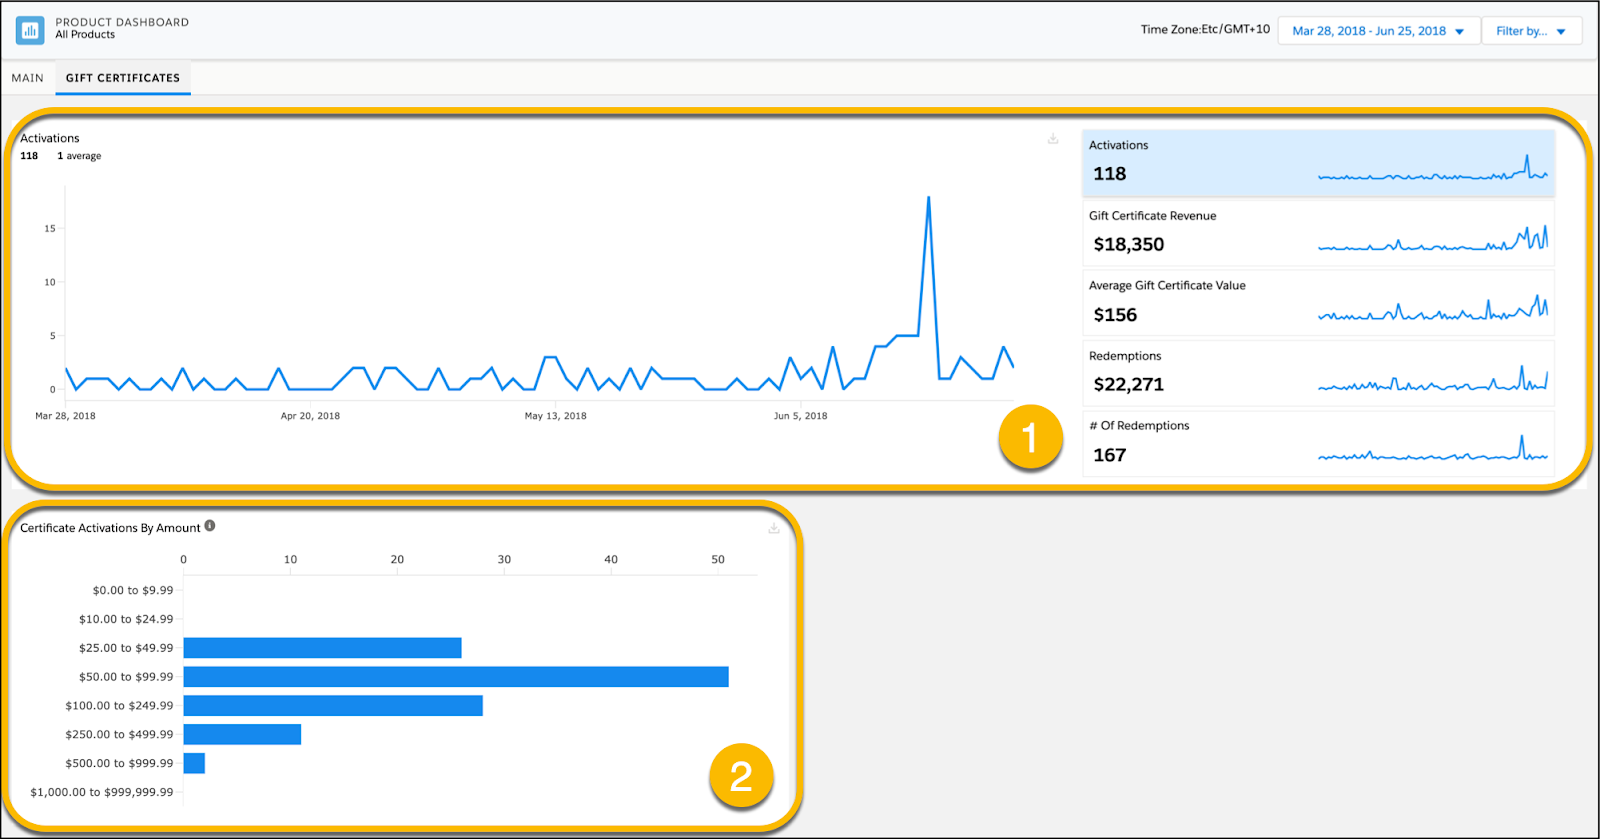
On the Products dashboard, you select the Gift Certificates tab to open the Gift Certificate dashboard, where you see these reports.
Report |
Description |
|---|---|
Gift Certificate Overview (1) |
These graphs provide snapshots of gift certificate activity. Select each graph in the right-hand menu to toggle through the site's gift certificate activity. Activations: Number of gift certificates activated during the given time period. Gift Certificate Revenue: Revenue from gift certificate sales. Average Gift Certificate Value: Average value of gift certificates sold. Redemptions: Value of redeemed gift certificates. Of Redemptions: Number gift certificate redemptions over the date range. |
Certificate Activations by Amount (2) |
Total gift certificate activations by a range of certificate amounts. |
Wrap It Up
In this unit you learned about the key analytics summarized on the Products dashboard, how filter settings carry over from the Products dashboard to the Product Detail dashboard, and how to track gift certificate activity. You can use these insights to identify your customers' purchasing habits and create more informed merchandising strategies.
In this badge you learned how to analyze sales and product performance using the Agentforce Commerce for B2C Sales and Product dashboards. Merchandisers can track key sales metrics, filter dashboard reports, export transaction data, and evaluate product and gift certificate details to make data-driven business decisions.