Configure a Forecast Set
Learning Objectives
After completing this unit, you’ll be able to:
- Add custom fields to the object Advanced Account Forecast Fact.
- Create a forecast set with multiple dimensions and measures.
Add Fields to Advanced Account Forecast Fact
The object Advanced Account Forecast Fact holds the forecast data for each period. Forecast measures and dimensions are available as fields on this object. First, Cindy must add a custom field to the object Advanced Account Forecast Fact for the new measure Actual Amount.
Remember, fields that are used as dimensions must be a lookup to an existing object. And fields that are used as measures must be either numeric or currency types. Quantity measures are of numeric type, and revenue measures are of currency type.
Here’s how Cindy adds a custom field to the object Advanced Account Forecast Fact.
- In Setup, click the Object Manager tab.
- Select Advanced Account Forecast Fact and then click Fields and Relationships.
- Click New, select Currency as data type, and click Next.
- Enter the label as
Actual Amount, and click Next.
- Make changes as required to the field-level security for various profiles, and click Next.
- Add the field to the default page layout and click Next.
- Click Save.
Later, Cindy plans to add the Actual Amount field to a new forecast set so that the field is visible on the forecast grid display. She also plans to update the Data Processing Engine (DPE) definition to ensure that the data is written back.
Create Dimensions and Period Groups
Next, Cindy defines a forecast dimension called Product. Later, she uses this dimension in a new forecast set. Each forecast set can contain up to six dimensions, including Period, which is a default dimension for any forecast.
- Click
 , and select Setup.
- In the Quick Find box, enter
Forecasting, and select Advanced Account Forecasting.
- Navigate to the Dimension tab.
- Click New and provide these details.
- Name:
Product - Source Object: Product2
- Click Create.
Next, Cindy creates the period groups that determine how often forecasts are calculated for business units. She can also define the number of forecast periods to display at any given time. Here’s what she does.
- In Setup, in the Quick Find box, enter
Manufacturing, and select Manufacturing.
- Under Feature Settings, click Advanced Account Forecasting, and navigate to the Period Groups tab.
- Click New, and provide these details.
- Name:
Period Group for AMER Sales - Status: Active
- Start Period:
0(Forecasts are generated from the current period.)
- Display Duration:
12 - Type: Month
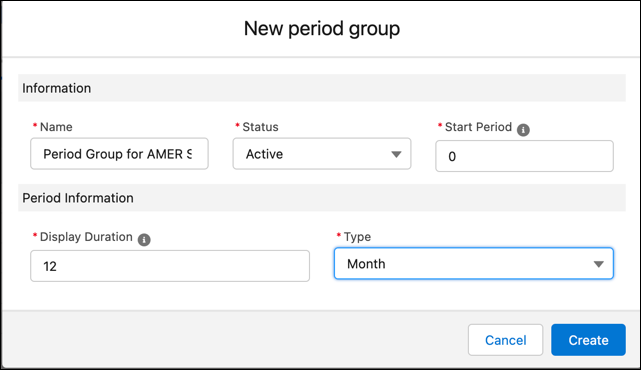
- Click Create.
Let’s look at an example to understand the configuration better. When account managers on Elliott’s team view an account’s forecast grid, the forecasts include 12 months, with the first period being the current month (0). So if the current month is January 2021, the forecast is displayed for January 2022 to December 2022. At the end of each month, the forecast display rolls over and adds another period to the display. So, at the start of February 2022, the forecast is displayed for February 2022 to January 2023.
Define a Forecast Set
Now it’s time for Cindy to create the forecast set.
- In Setup, in the Quick Find box, enter
Manufacturing, and select Manufacturing.
- Under Feature Settings, click Advanced Account Forecasting, and navigate to the Forecast Sets tab.
- Click New and provide these details.
- Name:
Forecast Set for AMER Sales - Period Group: Period Group for AMER Sales
- Forecast Facts Object: Advanced Account Forecast Fact
- Click Save.

Next, Cindy maps the fields required to generate forecasts with the fields in the org that must be used to populate the values in the forecast.
- Expand the Building Blocks section.
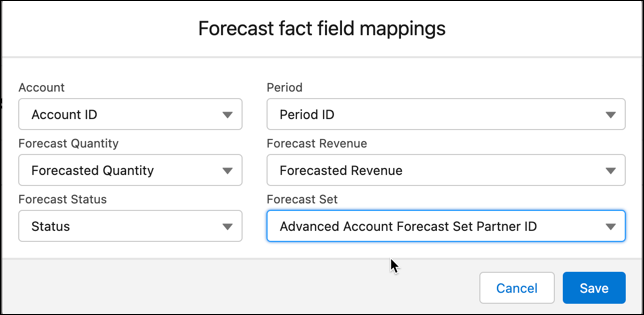
- On the Forecast Fact Field Mappings tab, click Edit.
- Select the following:
- Account: Account ID
- Period: Period ID
- Forecast Quantity: Forecasted Quantity
- Forecast Revenue: Forecasted Revenue
- Forecast Status: Status
- Forecast Set: Advanced Account Forecast Set Partner ID
- Click Save.
Now, Cindy defines the frequency at which the forecast is updated. She also defines the frequency at which new periods are added and the display rolls over.
- On the Forecast Frequencies tab, click Edit.
- Select the following:
- Calculation Frequency: Monthly
- Rollover Frequency: Quarterly
- Click Save.

A template is the predefined definition that comes with Manufacturing. To use the template, the admin must clone it to create a definition. Then, the admin can make changes to the definition and activate it. Cindy’s already cloned the four predefined DPE templates for Advanced Account Forecasting and activated them. She’s also added the suffix “_AMER Sales Forecasts'' to the names of the cloned DPE definitions to differentiate them from the templates. See Clone Data Processing Engine Templates for details.
- Cindy now selects the four definitions in the forecast set. On the Data Processing Engine Definitions tab, click Edit.
- Select the following:
- Generation Definition: Generate Account Forecast_AMER Sales Forecasts
- Rollover Definition: Rollover Account Forecast_AMER Sales Forecasts
- Recalculation Definition: Recalculate Account Forecast_AMER Sales Forecasts
- Regeneration Definition: Regenerate Account Forecast_AMER Sales Forecasts
- Click Save.

Next up, Cindy defines the display order for the dimensions she created.
- Expand the Forecast Dimensions section and click New.
- Specify the following values:
- Name:
Product - Dimension: Product
- Forecast Fact Dimension Field: Product ID (Product)
- Display Order:
1

Now, Cindy adds the measures to the forecast set that must be displayed on the forecast grid. She also defines how the values are calculated for each measure.
- Expand the Forecast Measures section, then click New.
- Provide the following details:
Name
Forecast Fact Measure Field
Measure Type
Aggregation Type
Calculation Method
Forecasted Quantity
Forecasted Quantity
Quantity
Sum
Forecast Formula
Forecasted Revenue
Forecasted Revenue
Revenue
Sum
Forecast Formula
Opportunity Quantity
Opportunity Quantity
Quantity
Sum
Batch Process
Opportunity Revenue
Opportunity Revenue
Revenue
Sum
Batch Process
Sales Agreement Quantity
Sales Agreement Quantity
Quantity
Sum
Batch Process
Sales Agreement Revenue
Sales Agreement Revenue
Revenue
Sum
Batch Process
Order Quantity
Order Quantity
Quantity
Sum
Batch Process
Order Revenue
Order Revenue
Revenue
Sum
Batch Process
-
Click Save.
Considering there are a lot of measures, Cindy wants to help the account managers declutter their forecast view. She creates two measure groups, each focusing on specific types of measures.
- Expand the Forecast Measure Groups section, then click New.
- Provide the following details.
- Name:
Quantity Measures - Default Group: No
- Move the following measures from Available Measures to Selected Measures:
- Forecasted Quantity
- Opportunity Quantity
- Sales Agreement Quantity
- Order Quantity
- Click Save.
- Repeat steps 1–3 with the following details:
- Name:
Revenue Measures - Default Group: No
- Move the following measures from Available Measures to Selected Measures:
- Forecasted Revenue
- Opportunity Revenue
- Sales Agreement Revenue
- Order Revenue

Next, Cindy defines different adjustment periods for different groups of users.

- Expand the Forecast Adjustment Periods section, then click New.
- Provide the following details.
- User Profile: Account Manager
- Frequency: Month
- Period Start Day:
1 - Duration Days:
5
- Click Create.
- Add another adjustment period with the following details:
- User Profile: Regional Manager
- Frequency: Month
- Period Start Day:
6 - Duration Days:
2
- Click Create.

Finally, Cindy creates formulas for quantity and revenue across all periods. These formulas are applied after the definitions are run.
- Expand the Forecast Formula section, then click New.
- Provide the following details in the Forecast Formula Builder:
- Start Period:
1 - End Period:
12 - Type: Quantity
- Formula:
0.8*Opportunity Quantity + Order Quantity + Sales Agreement Planned Quantity
- Click Create.
- Add another formula with the following details:
- Start Period:
1 - End Period:
12 - Type: Revenue
- Formula:
0.8*Opportunity Revenue + Sales Agreement Planned Revenue + Order Revenue
- Click Create.

- On the forecast set header, click Activate.

Whew! Cindy has finished defining the forecast set.
You saw she selected her cloned copy called Generate Account Forecast_AMER Sales Forecasts as the Generation Definition in the Data Processing Engine Definitions section. Later in this module, you see how Cindy customizes this DPE definition for all of Elliott’s requirements.
Dive In
Cindy has created fields on the Forecast Fact object and defined a forecast set. In the following units, she’ll work her magic on the DPE definition and bring the requirements to life.
Resources