Create a Travel Approvals Dashboard
Create a Dashboard
You can take your analysis to the next level by placing your reports on a Salesforce dashboard for quick and easy viewing. A dashboard provides an interactive visual display of key metrics and trends. Multiple dashboard widgets can be shown together on a single dashboard layout, creating rich visual displays of multiple reports that have a common theme.
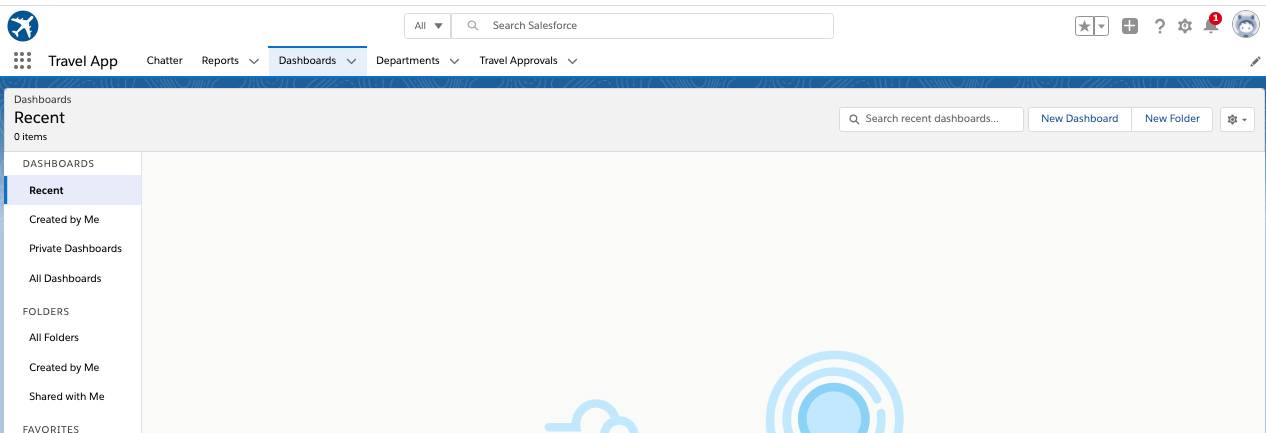
- Click the Dashboards tab.
- Click New Dashboard.
- Enter these values.
Parameter |
Value |
|---|---|
Name |
Travel Requests Dashboard |
Description |
Leave this blank |
Folder |
Private Dashboards |
- Click Create. You can now add reports to your dashboard and move them on to different sections of the dashboard. You can also stretch the widgets across the grid to have the exact layout you need for your dashboard.
- Click + Widget and select Chart or Table.
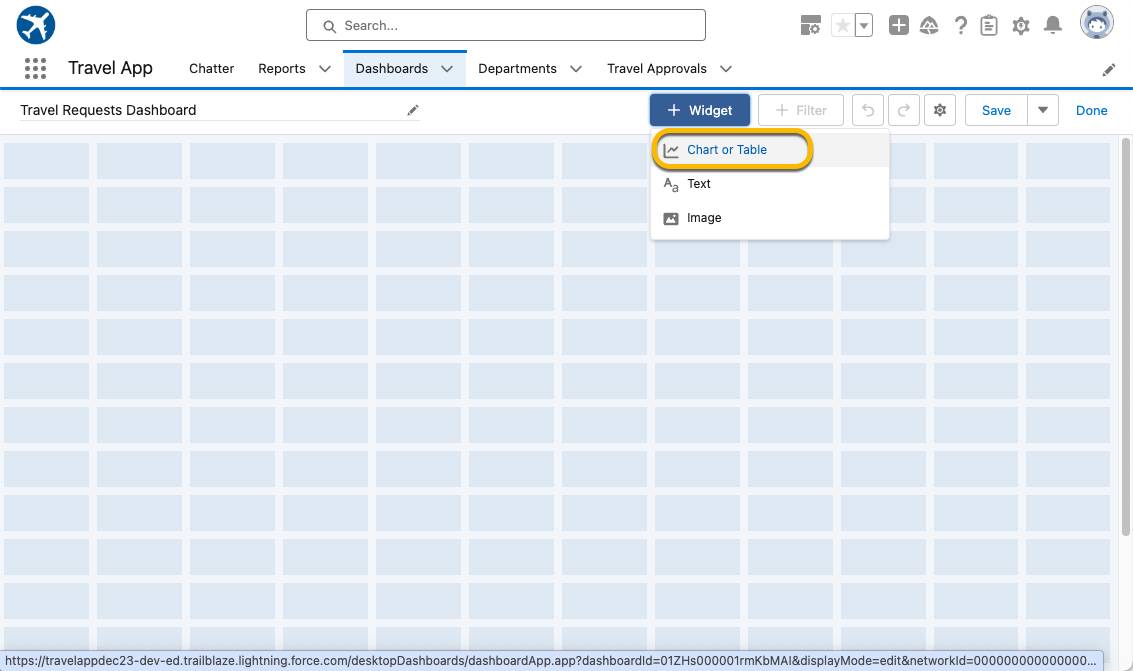
- Click the Travel Requests by Department report and click Select. You are presented with options to configure this widget for the dashboard.
- Make sure the Y-Axis is set to Department and the X-Axis is set to Record Count.
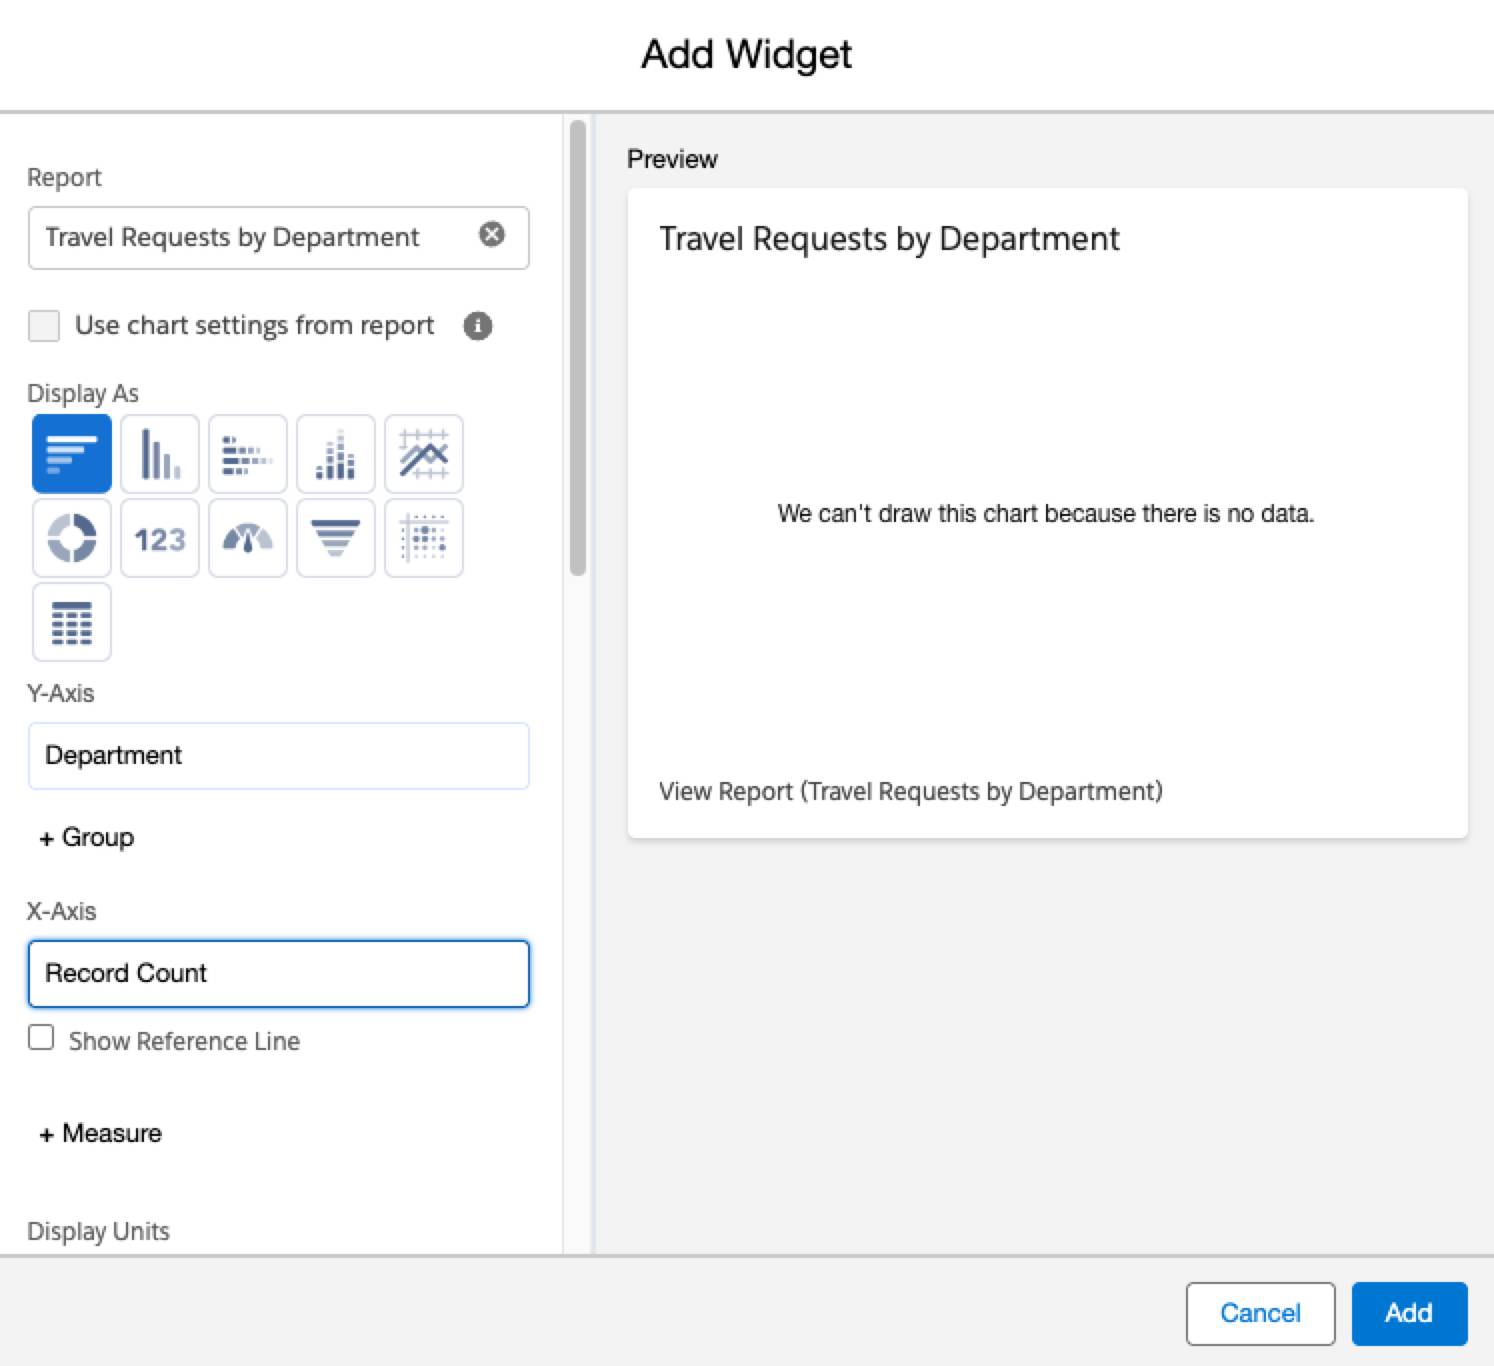
- Click Add.
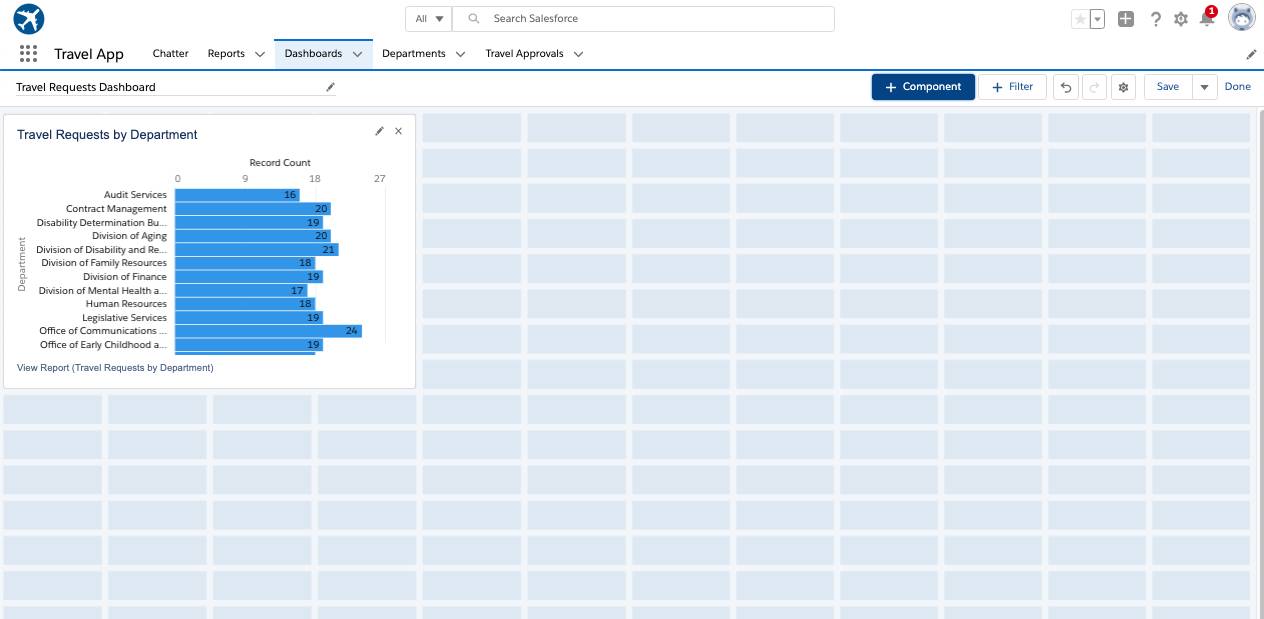
- Click + Widget to add our other report.
- Select the Travel Requests by Month report and click Select.
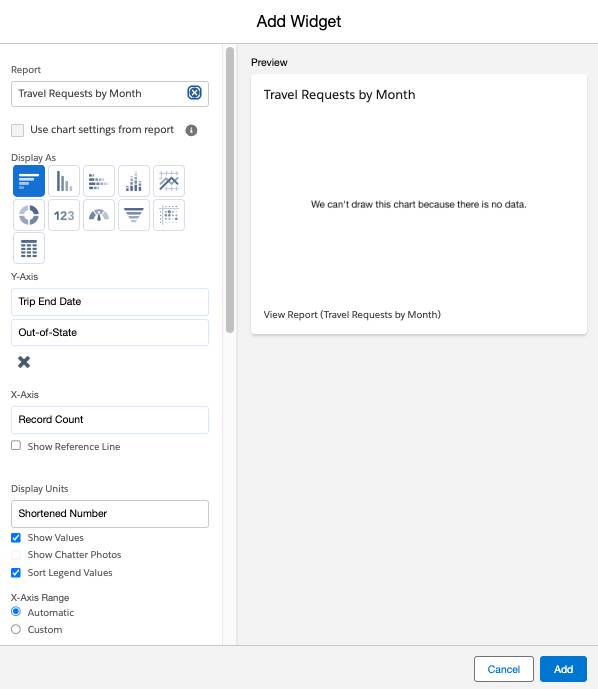
- Make this a vertical, stacked bar chart that sorts data from oldest to newest by adjusting the following:
Display As |
Vertical Bar Chart |
|---|---|
Sort By |
Trip End Date |
- Click Add.
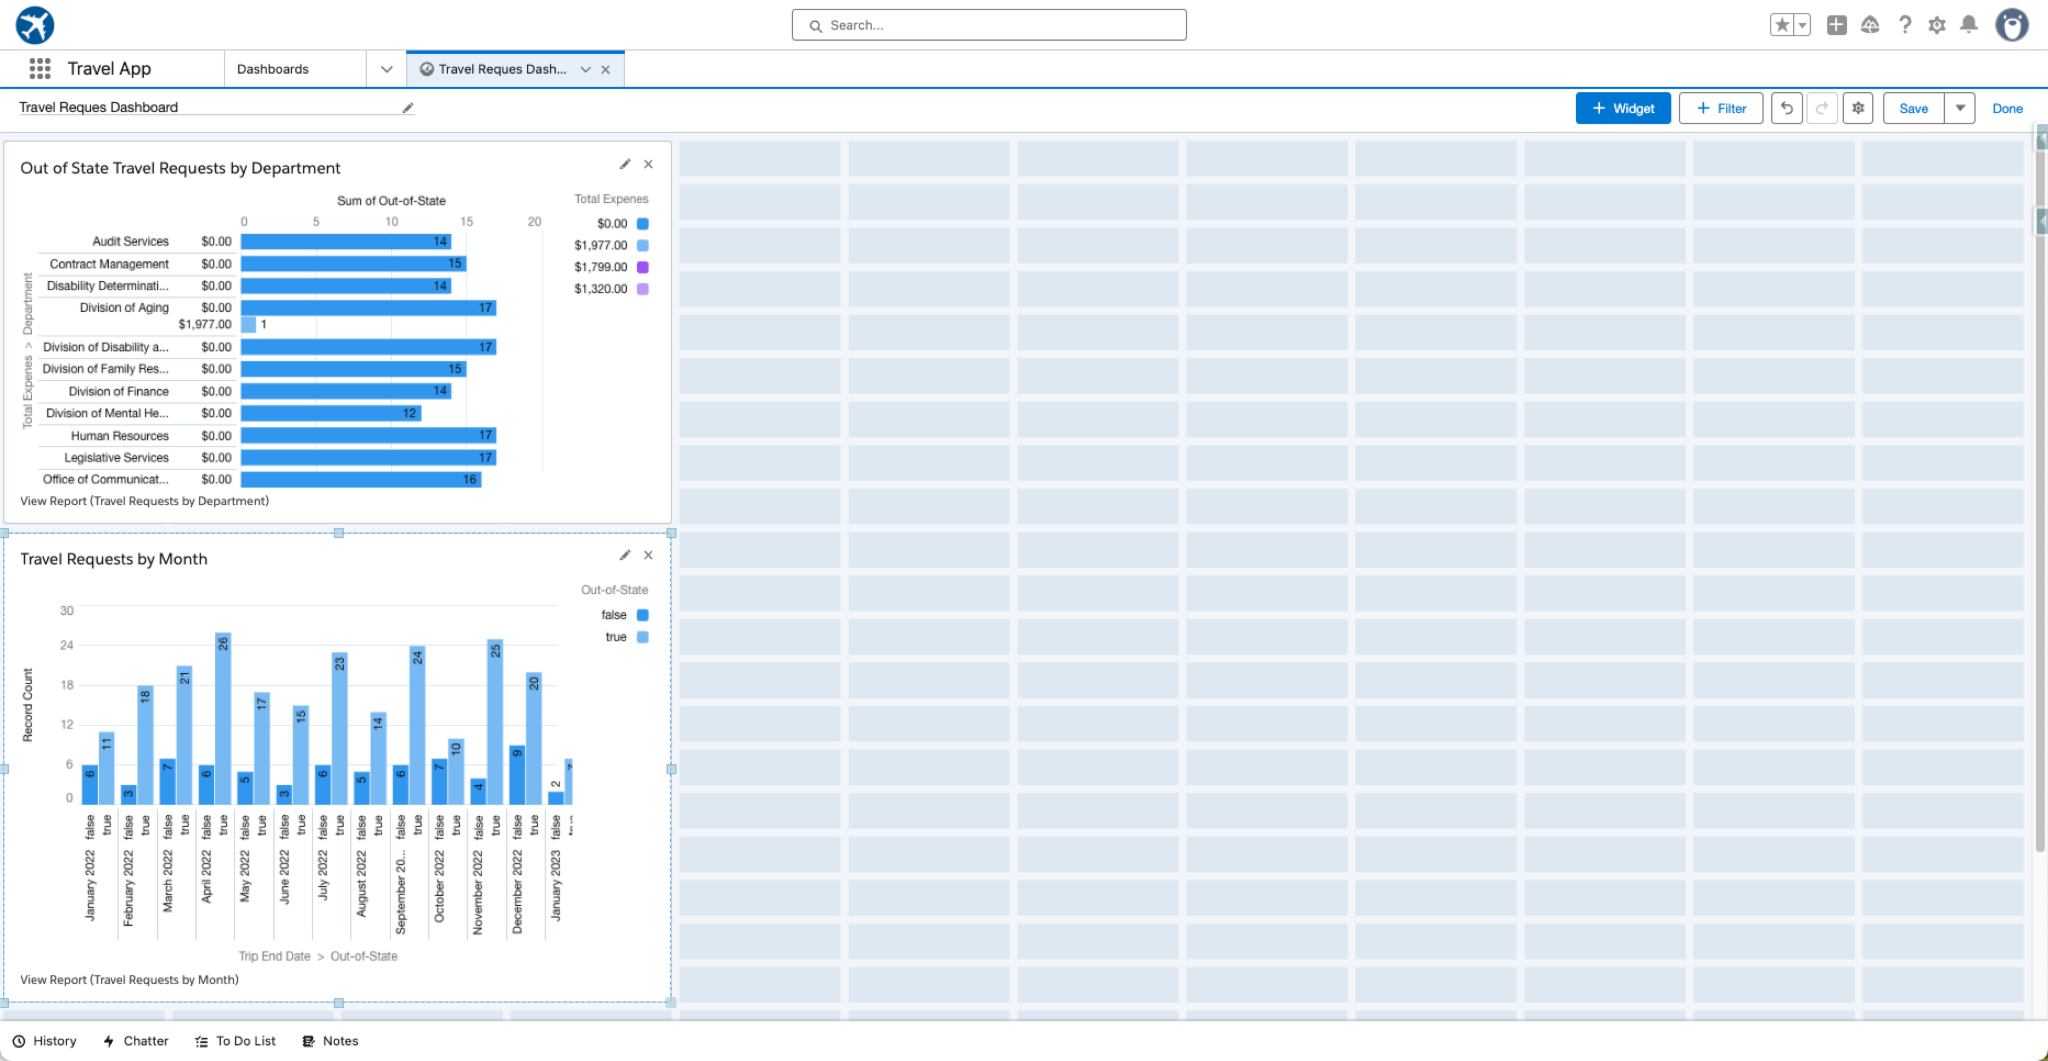
- Drag the chart on the bottom, and position it to the right of the first chart we added.
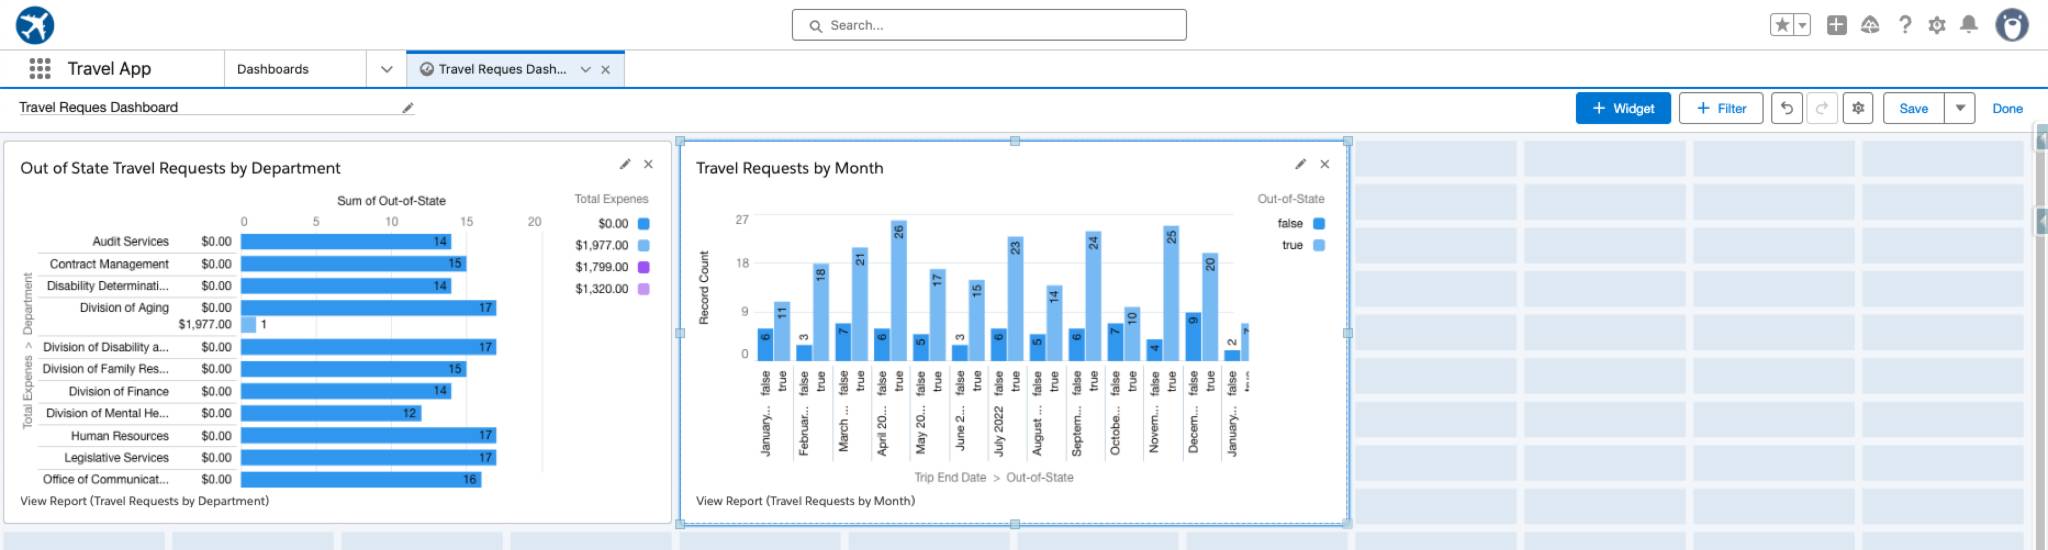
Notice that you have a very flexible grid structure. Play around with stretching your dashboard widgets to various shapes on the grid.
- Click Save and then the Done. Your dashboard looks like this.
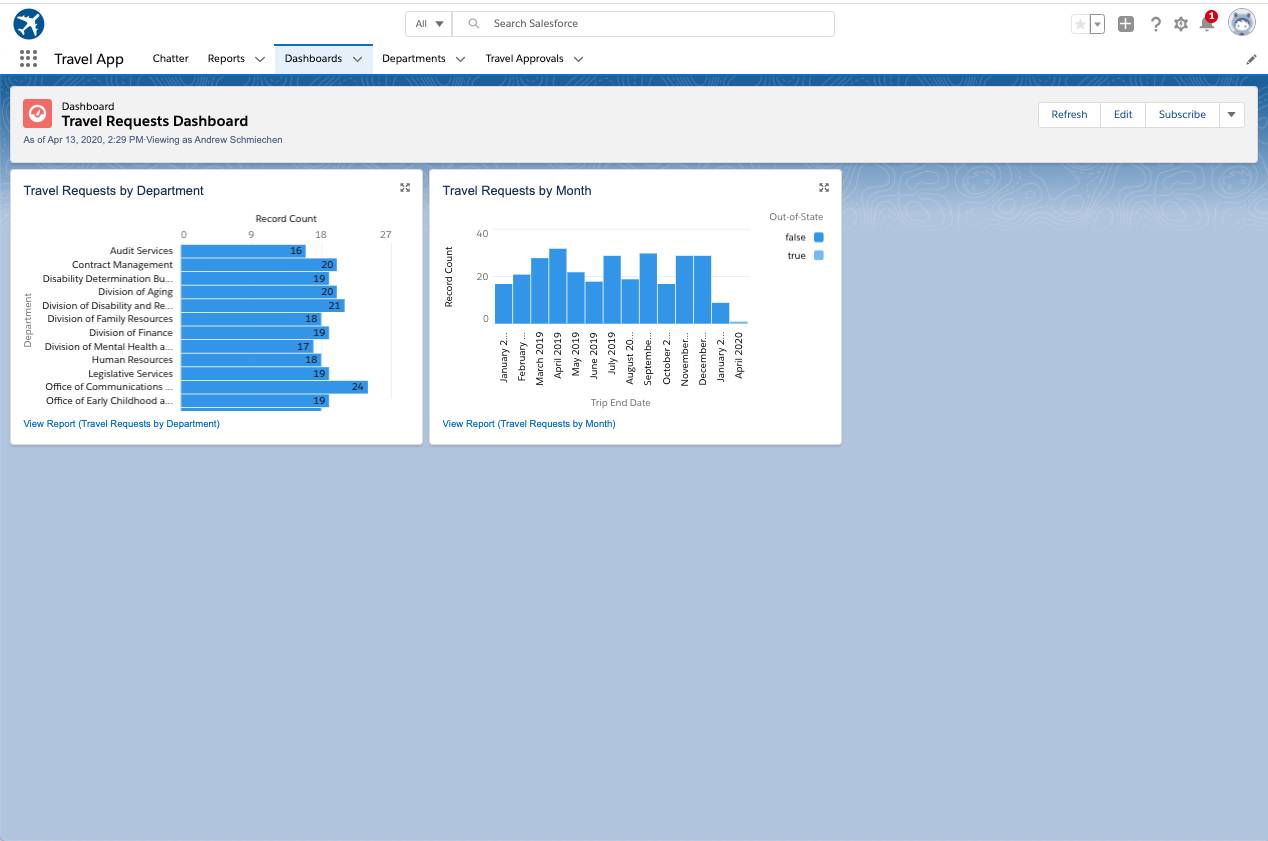
For real-world scenarios, you can add other reports to the dashboard and show data and key performance indicators (KPIs) from multiple objects from your database.
Congrats on completing the Travel App! You now have a single source of truth that can help control costs and limit unwarranted travel.
- Each employee must submit an electronic request in the system for future travel.
- Each request includes a list of estimated expenses for airfare, hotel, rental car, and so on.
- Each request must be approved by the employee’s manager, and all out-of-state travel must be approved by a travel coordinator.
- Managers have reports and a dashboard to track key travel request trends and KPIs.