Assess and Diagnose Data Quality
Learning Objectives
After completing this unit, you’ll be able to:
- Describe the five skills of the Data Quality Agent and when to apply each.
- Apply data quality assessment prompts to review quality scores and perform on-demand data profiling.
- Apply data quality diagnosis prompts to identify root causes for low quality scores.
Before You Start
Before you start this badge, consider completing this recommended content.
-
CLAIRE GPT Basics
-
CLAIRE GPT Interface and Navigation
-
CLAIRE GPT Discovery Agent
-
CLAIRE GPT Data Integration Agent
Trust Your Data Before You Use It
You already know how the Discovery Agent finds data and the Data Integration Agent helps move it. Before you build a report or hand off a dataset, though, you need to know whether you can trust it. That’s where the Data Quality Agent comes in. It helps you assess, diagnose, and improve the quality of the assets you’re working with.
Ana, the Cloud Kicks data analyst, uses the Data Quality Agent for the first time. She wants to know whether a dataset is trustworthy enough for an upcoming report.
The Five Skills of the Data Quality Agent
The Data Quality Agent achieves your data quality goals through five distinct skills, each suited to a different stage of understanding and improving your data.
-
Data quality assessment identifies and analyzes assets based on their data quality scores, statuses, or specific criteria you set, and can run on-demand data profiling when a profile doesn’t already exist.
-
Data quality diagnosis digs into why an asset has a poor score, and surfaces the data elements, dimensions, and rules that contributed to it.
-
Data quality rule recommendation suggests data quality rules for assets that don’t have any rules associated with them yet.
-
Data quality cleanse generates cleansed data and a reusable mapplet from a file or dataset that has quality issues.
-
Data quality rule generation extracts rule descriptions written in natural language, in a file or a prompt, and converts them into rule specifications in Data Quality.

Together, these five skills cover the full lifecycle of trusting and improving your data. You assess what you have, diagnose what’s wrong, get recommendations for preventing future issues, cleanse what’s already broken, and generate specifications when you’re starting from a written description rather than existing rules.
Most analysts start with assessment and diagnosis because those two skills help you determine whether any cleansing or rule work is worth the effort.
Ana needs to build a report using data from a corporate partner, but has never worked with the dataset. Rather than guessing whether it’s reliable, she turns to the Data Quality Agent. She starts with an assessment to review the current quality score before she decides whether to use the dataset.
Assess Data Quality
The data quality assessment skill lets you discover and analyze assets by data quality score, status, or other criteria. It can also profile data on demand when a saved profile isn’t available. A profile includes data types, statistics, and the number of null and unique values. This helps you spot outliers before you build anything on top of the data.
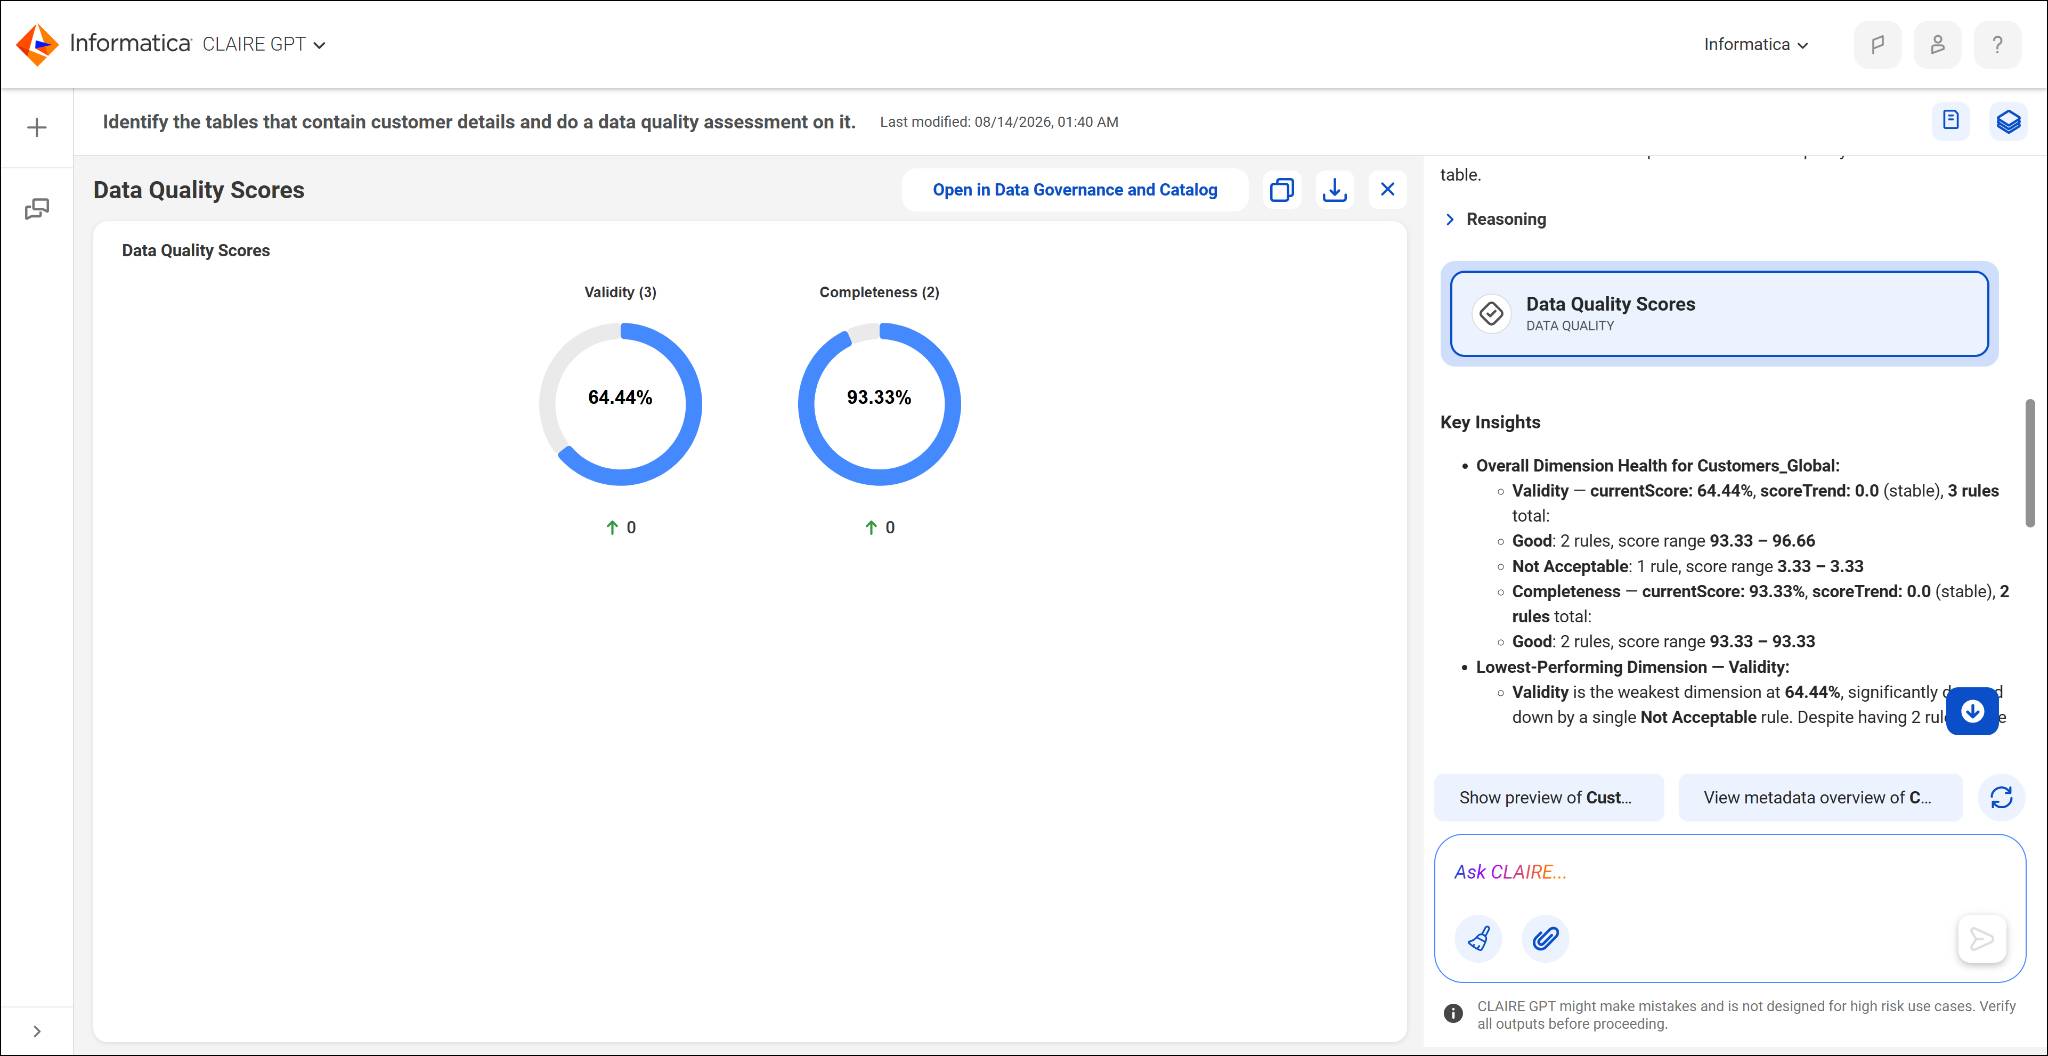
Ana starts by asking CLAIRE GPT to identify tables containing customer data and run a data quality assessment on them. CLAIRE GPT returns a card listing matching datasets from her connected catalog sources, each with a data quality score. After she identifies the table she wants, she asks for a detailed data profile. CLAIRE GPT profiles the first rows of the table and returns data types, null counts, and unique value counts.
Example prompt: “Identify the tables that contain customer details and do a data quality assessment on it.”
Diagnose Poor Data Quality Scores
When you find a low score, the data quality (DQ) diagnosis skill tells you why. It identifies the data elements and dimensions behind a poor score, the specific rules that contributed to it, and any records that violated those rules. The response also includes lineage insights that show how upstream and downstream assets affect the score.
Diagnosis is especially useful when a score drops unexpectedly between reporting periods. The lineage insights show whether the drop originated in the asset itself or came from an upstream source that changed.
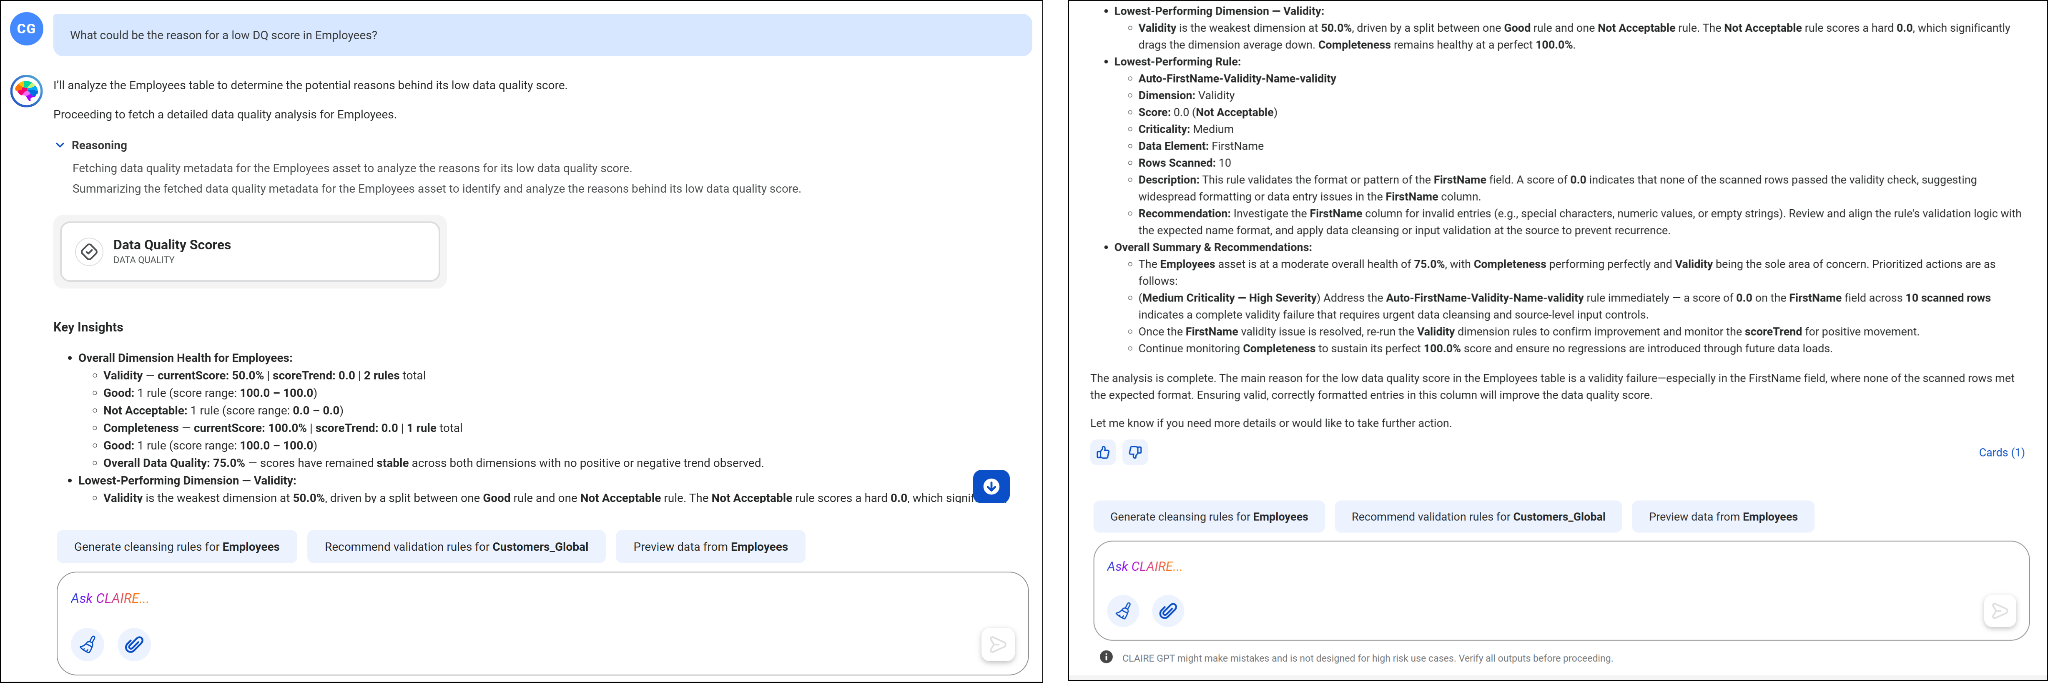
Ana’s HR colleague runs into an employee table with a surprisingly low quality score. Instead of guessing at the cause, he asks CLAIRE GPT directly why the score is low. The response breaks down the underperforming dimensions, the rules that failed, and provides a summary with recommendations to improve the score.
Example prompt: “What could be the reason for a low DQ score in Employees?”
Wrap Up
You can now assess a dataset’s quality score and diagnose exactly what’s influencing a low one. In the next unit, you act on those findings by asking CLAIRE GPT to recommend the rules that keep your data trustworthy.