Troubleshoot Storefront Performance
Learning Objectives
After completing this unit, you’ll be able to:
- List questions you might ask when troubleshooting poor site performance.
- Describe the tools you can use to investigate poor site performance.
- Describe the strategies you can use to investigate problems with the Agentforce Commerce for B2C Web Services framework.
- List ways to code for good site performance.
Go Faster

When storefront performance is slow or fails, you want to move fast to find the cause and fix it. This unit covers the questions to ask, the tools available, and the coding practices that keep your B2C Commerce system running at peak performance.
Ask Questions

When site performance slows down, start by asking questions.
Is the entire site slow?
Open the Reports & Dashboards tool and look at the real-time metrics tab to assess the site.
- Check correlations between an increase in sessions and requests and an increase in system workload.
- If the sales section shows a proportionate increase in orders, basket updates, and so on, determine whether bot or user traffic are the culprits.
Are search, product, or checkout pages slow?
If search, product, or checkout pages are slow, investigate client-side issues from static content or poor caching on controllers. The tools covered later in this unit help you track down the cause.
Are third-party calls taking too long?
Check how third-party services are performing, and confirm that web services are active. Verify that circuit breaker and rate limit settings are active with suitable numbers based on service profile usage in the code.
Are too many products showing on a page?
The more products that display, the more drain on all architectural layers. The product grid page response is the aggregate of all product hit tiles on the page. Each hit tile represents the included display of a product in the grid (using producthittile.isml). That’s a lot of hits. Limit the number of hit tiles per page and use lazy scrolling instead of a "View All" option.
An ALL products view degrades performance, because the storefront application tries to show all the products in the search results. Use the infinite scroll (lazy scrolling) technique instead, which uses AJAX calls to retrieve products as the shopper scrolls.
Use the Tools

These are the primary tools for diagnosing performance issues:
- B2C Commerce Reports & Dashboards
- Log Center
- The web services framework
As a last resort, the Admin clears the cache. Clearing all caches prevents data from being held longer than necessary. Too-frequent cache clears, however, negatively impact system performance and scalability. Avoid clearing the cache on a production system, because it can affect the shopper experience.
B2C Commerce Reports & Dashboards
The Technical dashboard helps optimize server-side performance and increase the scalability and predictability of your applications. Focus on:
- The top contributors to overall processing time.
- Which endpoints contribute most to overall processing and offer the biggest potential for improvement.
- How many requests have been read from the cache, and calculated and stored to the cache—numbers that are always dynamically calculated.
Log Center
The Admin uses Log Center to find error messages quickly. Search for a specific message by date, by instance, or using other attributes. Watch for messages like these:
- errorMessage=Rate Limit Exceeded
- errorMessage=SocketTimeoutException: Read timeout
- errorMessage=Failure Count Exceeded
- status=SERVICE_UNAVAILABLE
The Web Services Framework
The Admin uses the web services framework to create and maintain web services, such as REST, SOAP, and HTTP services. The framework is also the only way to monitor and activate or disable services—direct calls outside the framework don’t support this action. On the Service Status page, review the overall status of web service calls and check for error, meantime, and available rates. Click a service name to investigate a poorly performing service and review these indicators:
-
Real-time service status: View call status and the number of calls per second. Observe real-time, weekly, and daily trends. Focus on specific sites. Zoom in under the real-time trend tab to view data.
-
Real-time call duration: View the call duration in milliseconds. Observe real-time, weekly, and daily trends.
Use these strategies with this tool:
- Place all web services under the web services framework.
- Configure the web services framework to time out to avoid thread exhaustion.
- Use the log filtering callback method to remove private or sensitive data from the log message.
- Timeouts:
- Identify critical and noncritical web services. Configure lower timeouts for noncritical services.
- Examine the average weekly performance, and set the optimal connection timeout on all web services. The timeout setting is mandatory.
- Set values for connection timeout and circuit-breaker settings for third-party web services based on response time service-level agreements (SLA) with third-party endpoint providers.
- Identify critical and noncritical web services. Configure lower timeouts for noncritical services.
- Create a backup plan for critical services. For example, if the specified third-party tax service isn’t working properly, set the B2C Commerce tax service as the default service.
- Strategically use circuit breaker and rate limiter on services.
- Use
LocalServiceRegistryinstead of the deprecatedServiceRegistry.
Code for Peak Performance

When system performance degrades, investigate your code using the Reports & Dashboards Technical report, Code Profiler, the Storefront Toolkit, and browser tools. Keep these tips in mind for the best performance.
Use this tool to:
- See which controllers contribute to the response time on the platform side.
- Review average response time, requests, and total processing times to look for patterns.
- Review controller cache-hit ratios. Aim for high cache usage for most pages. The minicart, account, and checkout pages aren’t cached because they contain shopper-specific data. These components are served as remote includes so that the parent page frame around them stays cacheable.
Code Profiler
Here’s how to access Code Profiler.
- In Business Manager, go to Administration > Operations > Code Profiler.
- Select the mode: Extended Script Development.
image6Alt text: Code Profiler Extended Script Development mode
- Filter by Category equals REQUEST. A list shows the most calculation-heavy requests at the top. With production data, you typically see a short list of endpoints that contribute to most of the processing time.
- Sort by Elapsed Time > Sum to surface the most calculation-heavy requests.
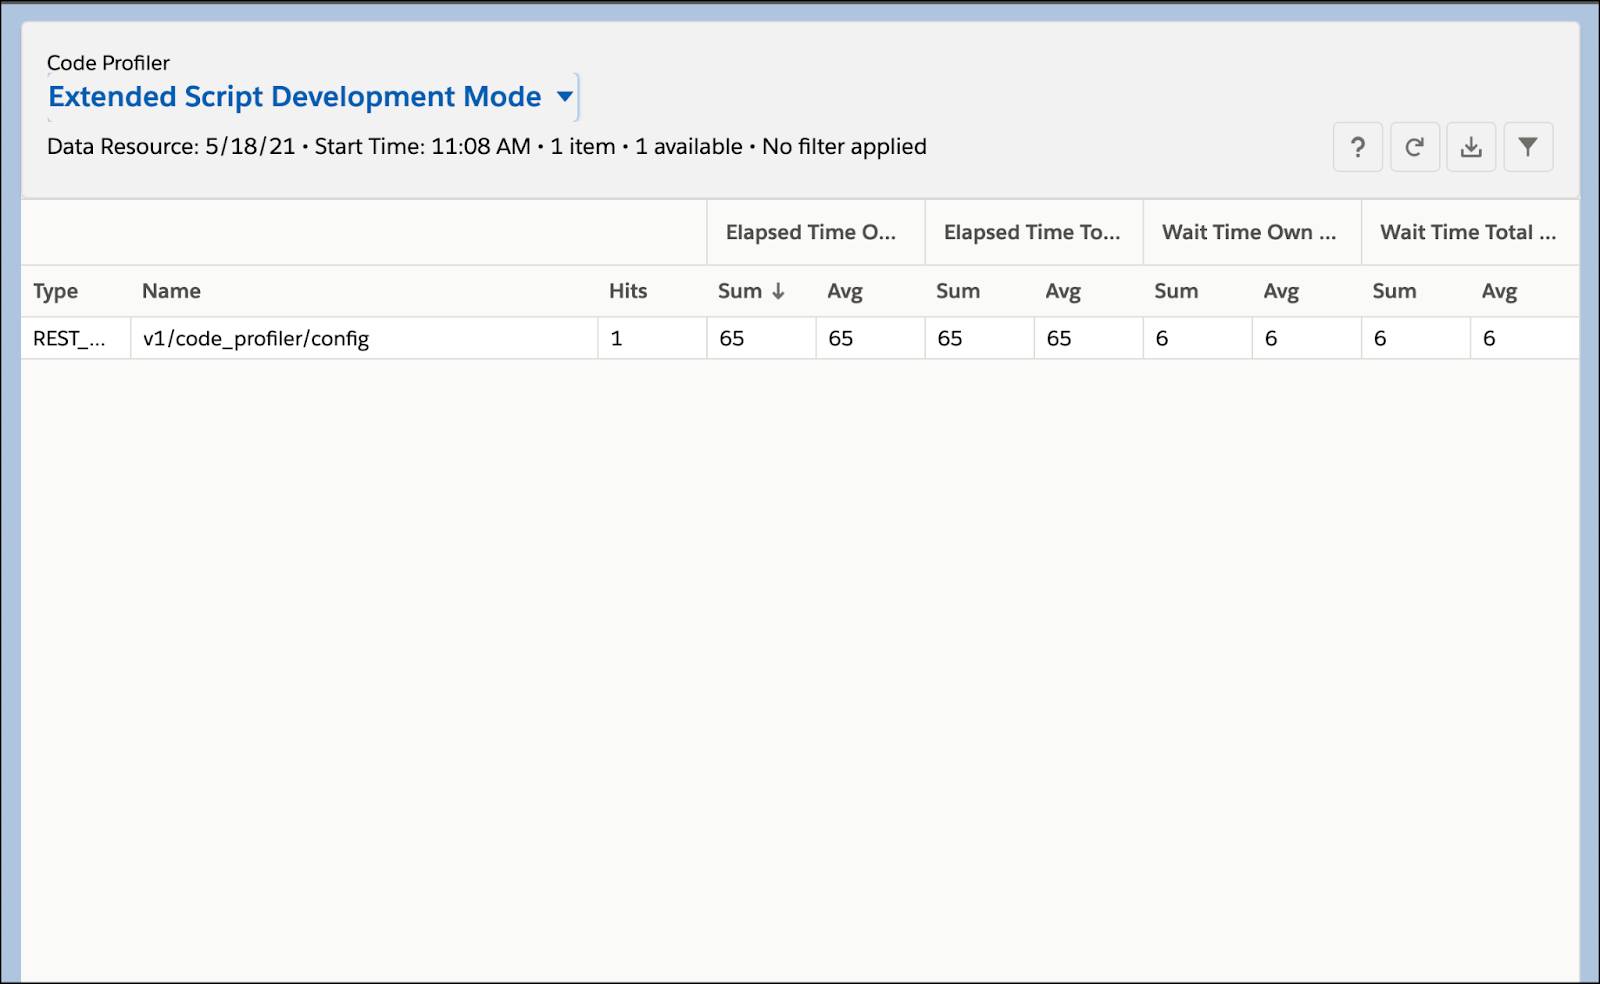
- Click an endpoint to see the functions that contribute to its runtime.
- Sort the detail view by Elapsed Time Own > Sum to identify the specific scripts and methods with the largest individual contribution to runtime.Extended Script Development mode]
Storefront Toolkit
Open the Storefront Toolkit in Business Manager to look at:
-
Cache info: Review cached and uncached page components.
-
The request log: Review log entries related to the most recent request from the storefront to the server.
Tips for Faster Code
Avoid iterating over products and categories. For example, after you have the search results, you don’t iterate again through product variants on the category grid pages. The search-show controller has all the information that it has.
In this table, The "don’t use" methods iterate over products, categories, or orders. You don’t want that.
|
Use these methods
|
Don’t use these methods
|
|---|---|
ProductSearchModel.search() ProductSearchModel.orderableProductsOnly(flag) ProductSearchRefinements.getNextLevelCategoryRefinementValues(Category) ProductSearchHit.getRepresentedVariationValues(ProductVariationAttribute) ProductSearchHit.getMinPrice(), ProductSearchHit.getMaxPrice() Use the Scripting API: CustomerMgr.searchProfiles(...) CustomerMgr.processProfiles(...) OrderMgr.searchOrders(...) OrderMgr.processOrders(...) |
Category.getProducts() Category.getOnlineProducts() Category.getProductAssignments() Category.getOnlineCategoryAssignments() ProductMgr.queryAllSiteProducts() Product.getPriceModel() Product.getVariants() Product.getVariationModel() OrderMgr.queryOrders() |
Use remote includes carefully.
- Remote includes have their own cache duration, while local includes use the include with the lowest cache duration as the default.
- A controller with a low number of includes but a high total processing time often points to a problem with the associated includes.
- Use remote includes to build partial pages when page data is unlikely to change, such as for product-hit tiles.
- Use remote includes as a strategy to delink portions of the page that you don’t want to cache or for which you want to specify a cache time that’s different from the parent-page cache time.
- The platform supports a remote include depth of up to 16 levels. Keep nesting depth as low as practical. Salesforce recommends that you limit the depth of remote includes to anywhere from 3 to 7, with the lower the better rule of thumb.
- Cache the search refinement panel using a remote include so that the site can serve the panel from the cache when there are multiple refinements.
Here are more tips.
- Avoid third-party service calls on highly visited, tile-driven pages, such as Home-Show, Product-Show, and Product-Hit.
- Use cache partitions to clear the cache for specific controllers instead of invalidating the entire cache.
- Use HTTP GET instead of POST for form transmission with cached results. A POST bypasses the page cache altogether and makes server-side calls.
- Page content is stored in the cache against the original request URL. Ensure that request URLs for this type of page content are not unique.
- Disable refinement crawling in robots.txt.
- Avoid adding logic in on-request or on-session calls, because it slows down every request.
- Don’t reserve a basket multiple times in the same request or reserve a basket and create an order in the same request.
Wrap It Up
In this unit, you learned how to use tools to troubleshoot performance problems.
Resources
- Salesforce Help: B2C Commerce Reports & Dashboards
- Salesforce Help: Log Center
- Salesforce Help: Web Services
- Trailhead: Holiday Season Readiness with Salesforce B2C Commerce
- Trailhead: Salesforce B2C Commerce Storefront Security Strategies
- Salesforce Developer Doc: Site Performance
- Salesforce Help: Storefront Toolkit