Explore CMDB and Discovery Dashboards
Learning Objectives
After completing this unit, you’ll be able to:
- Describe how discovery targets and scan jobs are used to fetch and review asset data.
- Identify the appropriate discovery method to use based on the type of IT infrastructure.
Match the Method to the Machine (Not the Madness)
Let’s put everything you have learned into practice. In the previous unit, you explored the three methods used to populate your Configuration Management Database (CMDB): agentless, agent-based, and API-based discovery. While Agentforce IT Service gives you the flexibility to use any of these methods, there are no hard-and-fast rules that dictate when to use each one. Instead, IT professionals typically find success by matching their strategy to the type of device they are trying to discover.
-
End-user computing (EUC): This is usually tracked via agent-based discovery. Devices like employee laptops frequently drop off the corporate network, so they might miss a scheduled network scan. A lightweight agent installed on the endpoint ensures data is securely captured and sent back whenever the device connects.
-
On-premise infrastructure: This is usually tracked via agentless discovery. Devices like physical servers, routers, and data centers are typically always on and connected to the corporate network. This makes them perfect targets for scheduled, routine remote network scans using a central discovery app.
-
Cloud infrastructure: This is tracked via integration/API-based discovery. This method uses secure credentials managed by Salesforce Agentforce IT Service to connect directly to public clouds like Amazon Web Services (AWS) or Microsoft Azure, seamlessly pulling in cloud footprints like virtual machines (VMs), block storage, load balancers, security groups, and databases.
Orivian Global Holdings Expands
If you completed the Agentforce IT Service Basics badge, you remember Orivian Global Holdings, a diverse international conglomerate with expanding operations across multiple industries. Now imagine you are the lead IT administrator at Orivian. To expand its Orivian HealthSystems division, the company recently acquired a chain of regional healthcare clinics. Suddenly, your IT team inherited a massive, undocumented mix of technology, including a sprawling public cloud footprint.
Fortunately, your CMDB manager and Salesforce admin have already teamed up to complete the heavy administrative lifting. They successfully configured the secure API credentials for the newly acquired Microsoft Azure environment and defined it as a specific discovery target in the system.
Now, it is your job to run the scan, ingest the data, and make sense of this massive new IT estate. Let's dive in!
A Panoramic View: The Home Page
From the App Launcher, navigate to the CMDB and Service Graph app. The first thing you see is the Home page, which acts as your command center. It is split into two distinct sections:
-
Configuration management: This section looks at the assets. It features dashboard widgets like Items by Type, Items by Location, Items by Status, and Top Incident-Generating Items to flag problematic assets.
-
Discovery: This section looks at the process. It features widgets like Active Discovery Sources, Items Updated, Items Not Updated (to catch stale data and gaps in scan coverage), and a list of your Latest Discovery Scan Jobs. This helps you ensure your automated ingestion engine is actually doing its job and returning fresh data.
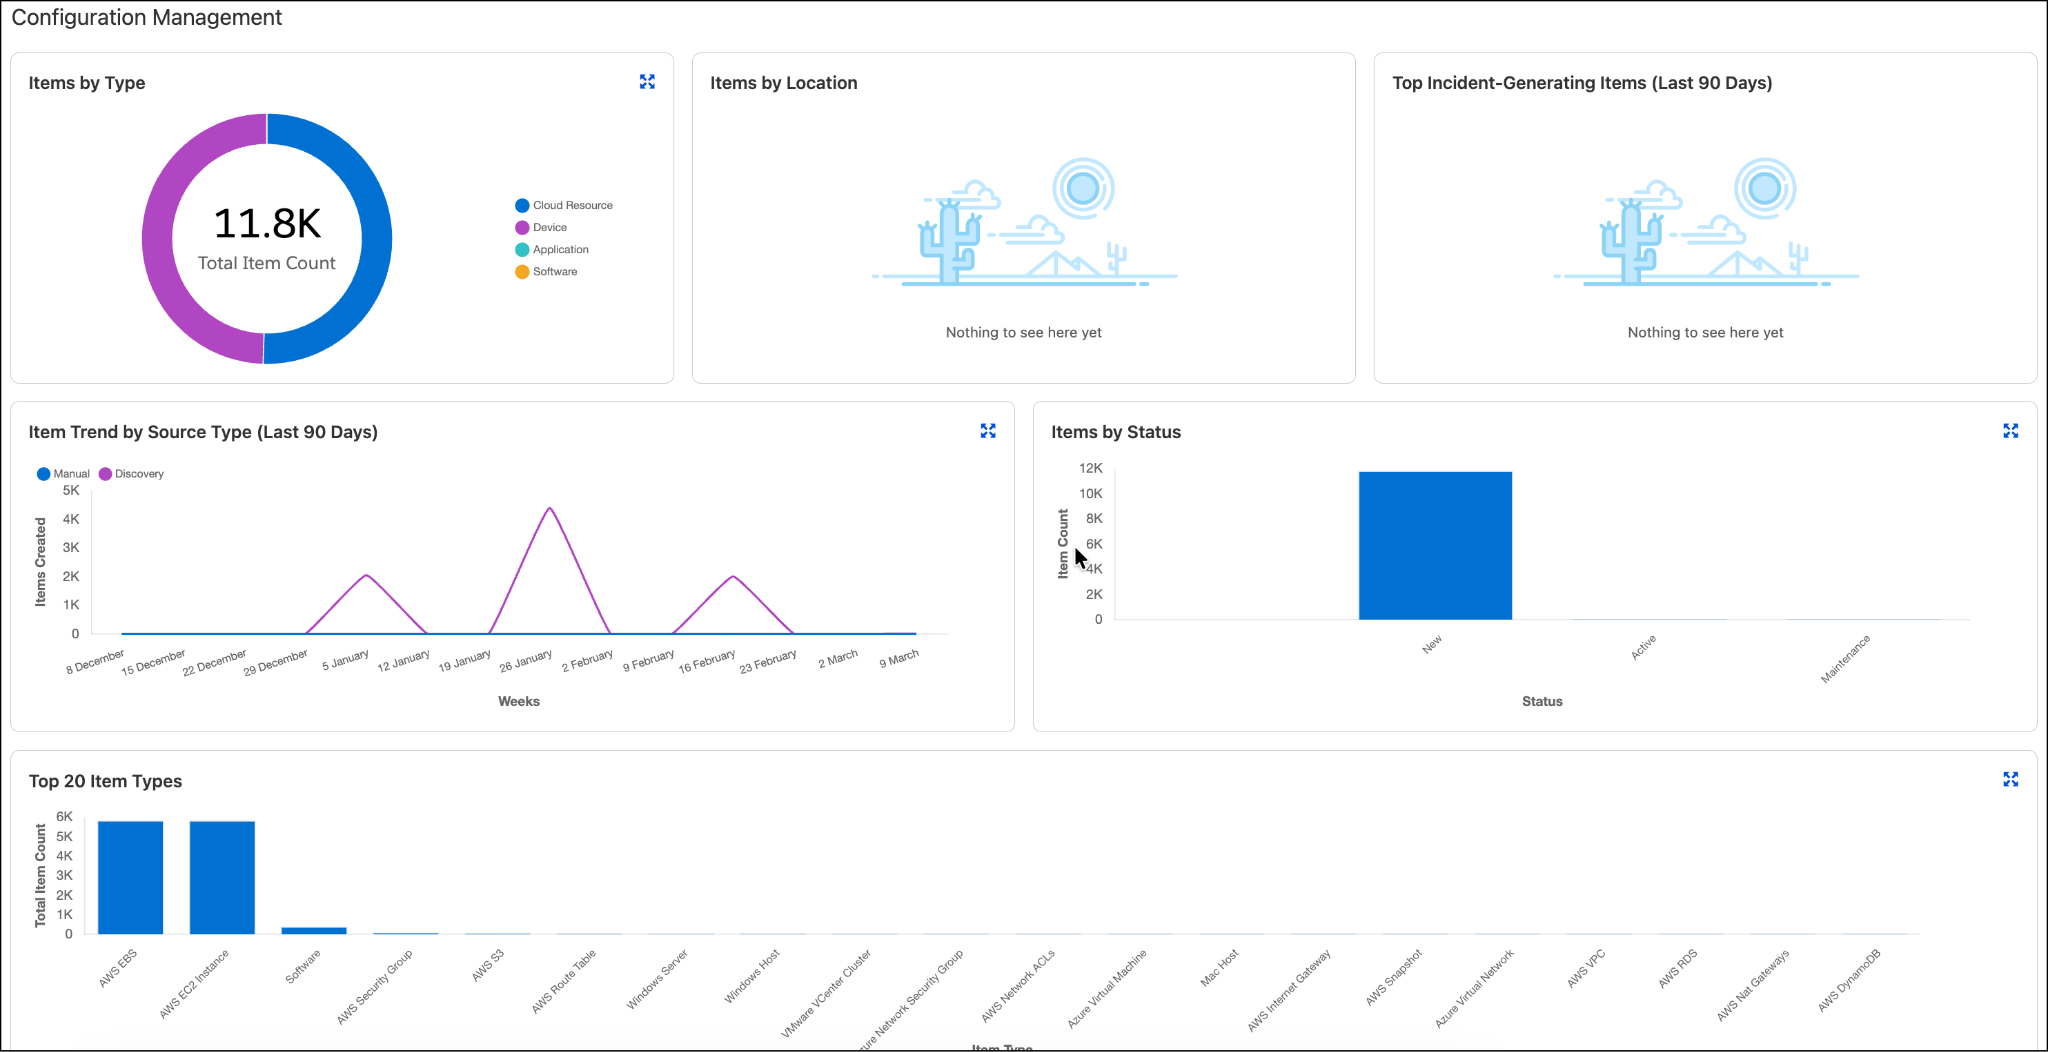
Just below Configuration Management you’ll find Discovery.

The dashboards look great, but it is time to bring in the newly acquired clinic data and get a closer look.
Fire Up the Ingestion Engine
In the left-hand navigation menu, under Discovery & Scanning, select Targets. This opens a list of all the environments your team has configured for scanning. You locate the Azure Cloud Staging target, click the dropdown arrow, and select Run Scan.
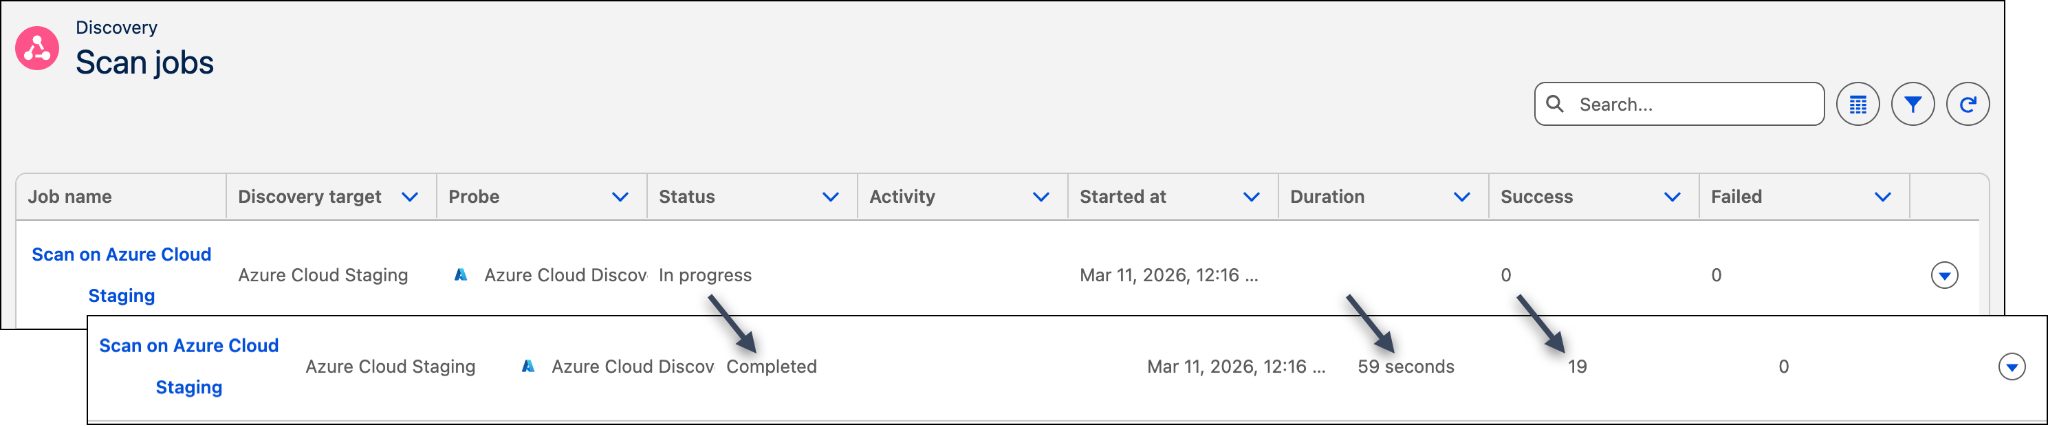
Just like that, the API-based discovery engine connects directly to Microsoft Azure and begins pulling in data. Once the scan is started, you can check back later for results. Or, for smaller environments you can stick around and refresh a few times to watch the progression. For example, you can see the Status change from In progress to Completed, see how long the scan ran (Duration), and how many assets were actually found (Success).

Making Sense of the Scan Results
Once the scan is complete, you need to see exactly what you caught in your net. You navigate to Scan Jobs and click into the completed Azure Cloud Staging record.
The Scan Job record provides a highly detailed breakdown of the execution. The first thing you review is the Host Summary.

The summary tells you that the scan found 19 total resources. It also categorizes them, showing exactly what kind of cloud-native infrastructure was brought over, such as Azure Virtual Networks, Network Security Groups, and Virtual Machines. This is very helpful high level information, but don’t ignore the Scan Details and Scan Logs tabs. These tabs provide tons of details on your scan. Scroll down a bit further, to see the Discovered Assets list.

Think back to the panoramic diagram near the end of the previous unit. The CI data returned from the scan is shown here. At a glance you see the asset name and CI Type, with way more detail if you click the CI Reference link. Click around and you can see details on when discovery was originally run, details of the asset itself, components, relationships, scan histories, and so forth. Notice the tabs in the Discovered Assets: All, New, and Updated. That also aligns with the panoramic diagram. When CI data is returned and then processed, you can view all the data or review:
-
New: Lists assets that the system identified for the very first time. Because they didn't exist in your database, the system automatically creates brand-new configuration items (CIs) for them.
-
Updated: Lists existing assets that had data changes since the last scan. The system intelligently refreshes these existing CIs rather than creating duplicates.
By running this single scan, you successfully identified, categorized, and cataloged 19 new pieces of cloud infrastructure—all without manually entering a single row in a spreadsheet.
In this unit you followed along as Orivian gathered asset data. In the next unit, see how the IT team puts this newly discovered data to work using interactive service maps to avert a major crisis.