Analyze the Knowledge Analytics Dashboard
Learning Objectives
After completing this unit, you’ll be able to:
- Navigate the Knowledge Analytics dashboard to monitor performance.
- Analyze key metrics to identify knowledge gaps and measure article quality.
Introduction: The Feedback Loop
In the previous units, you learned how to capture resolutions and create new articles. But how do you know if that content is actually helping? Are employees finding the answers they need, or are they still logging tickets for issues you’ve already resolved and documented?
You don’t need to guess. While Agentforce IT Service doesn’t ship with standard out-of-the-box (OOTB) dashboards automatically populated on day one, you aren’t left in the dark.
Two Paths Forward
There are two common paths forward to help jumpstart your analytics, allowing you to instantly see and act on data tied to your knowledge base.
AgentExchange
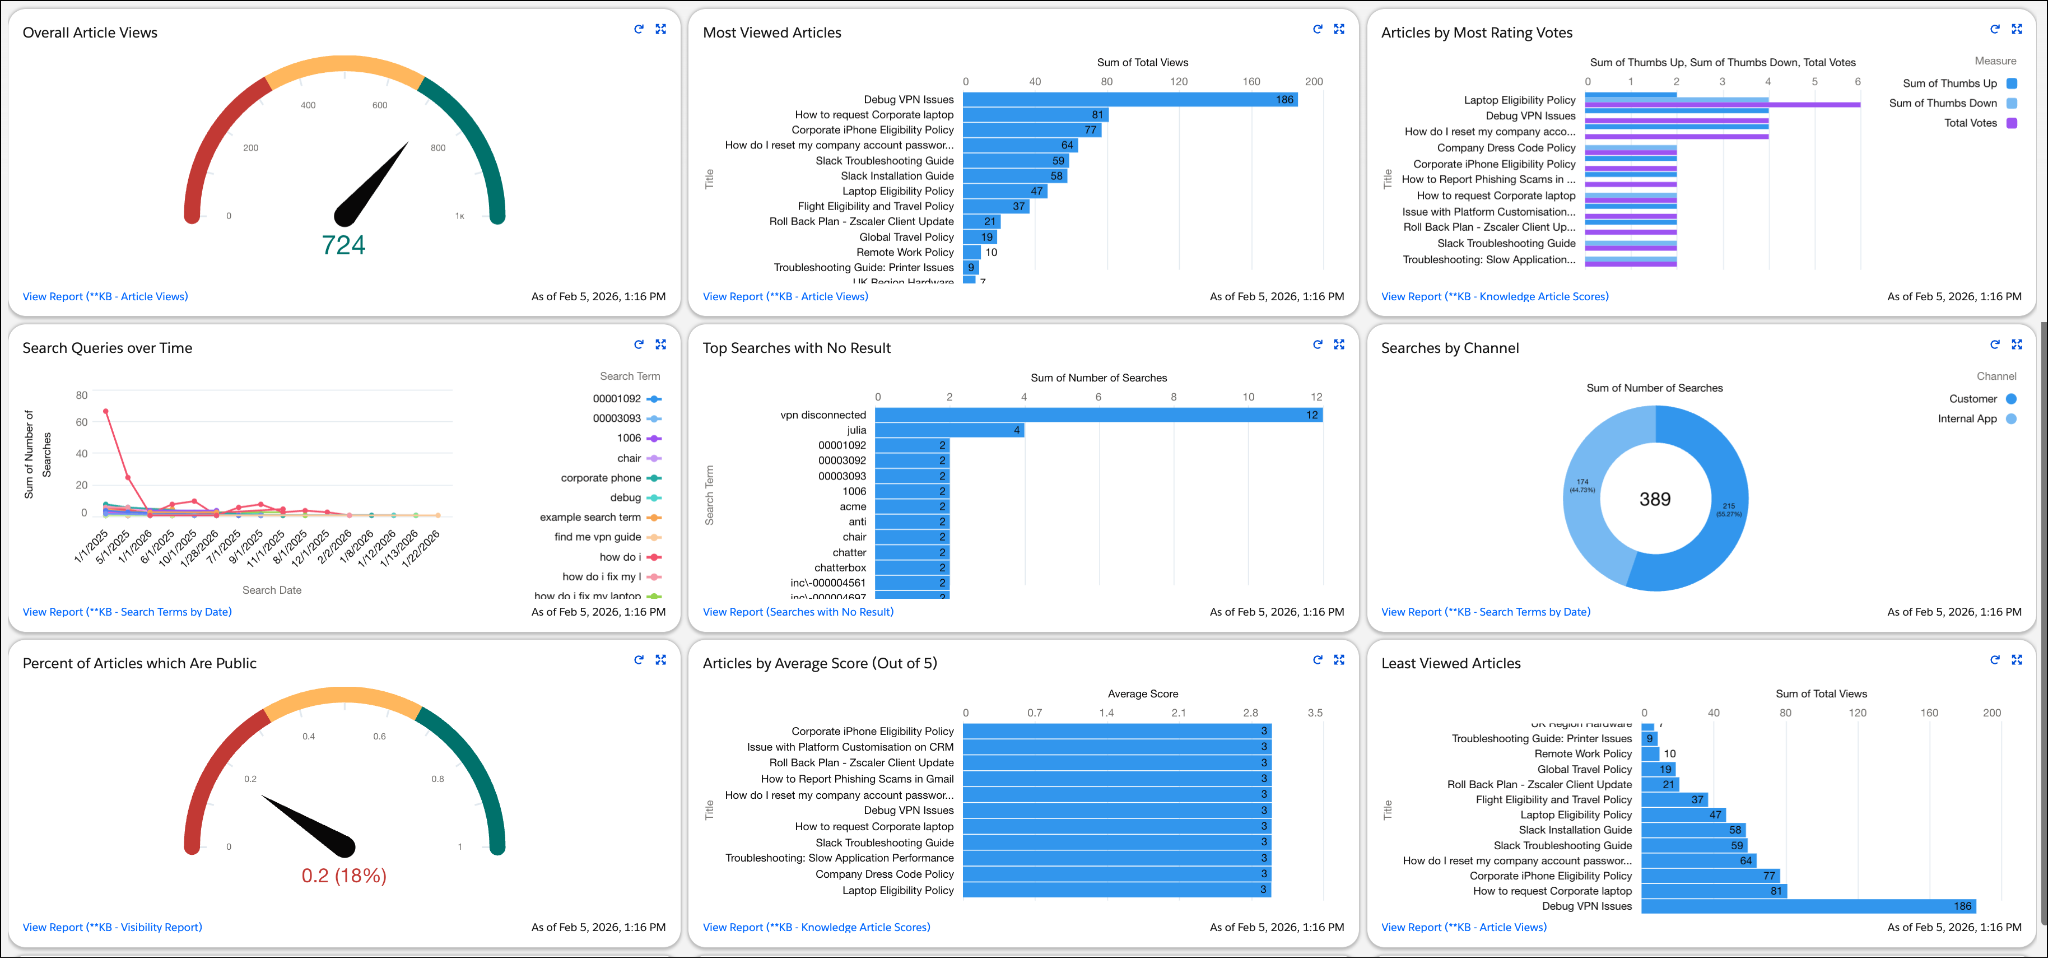
Many organizations start by downloading pre-built dashboard packages from the Salesforce AgentExchange. For example, the Lightning Knowledge Dashboard is quick to install and provides great foundational insights, such as which articles are viewed the most and what search terms are commonly used. It can be cloned and modified to address your organization’s needs as well. Oh, and the price is right: Free!
These foundational insights are a great start, but when you are ready for superior data that proves true business impact, it’s time to step up to Tableau. It offers deeper metrics and is highly customizable.
Agentforce IT Service Analytics
Agentforce IT Service Analytics is powered by Tableau, and offers organizations deeper insights with the Knowledge Analytics dashboard. It goes beyond simple views and actively measures how your knowledge base impacts your IT team’s bottom line, tracking advanced metrics like time saved and tickets deflected.
Use the dropdowns at the top of the dashboard to focus exactly on the data you are interested in. For example, filtering the Source Reference object to include only Incident and Problem records tailors the dashboard to your IT service desk, omitting unrelated data like general HR cases or change requests.
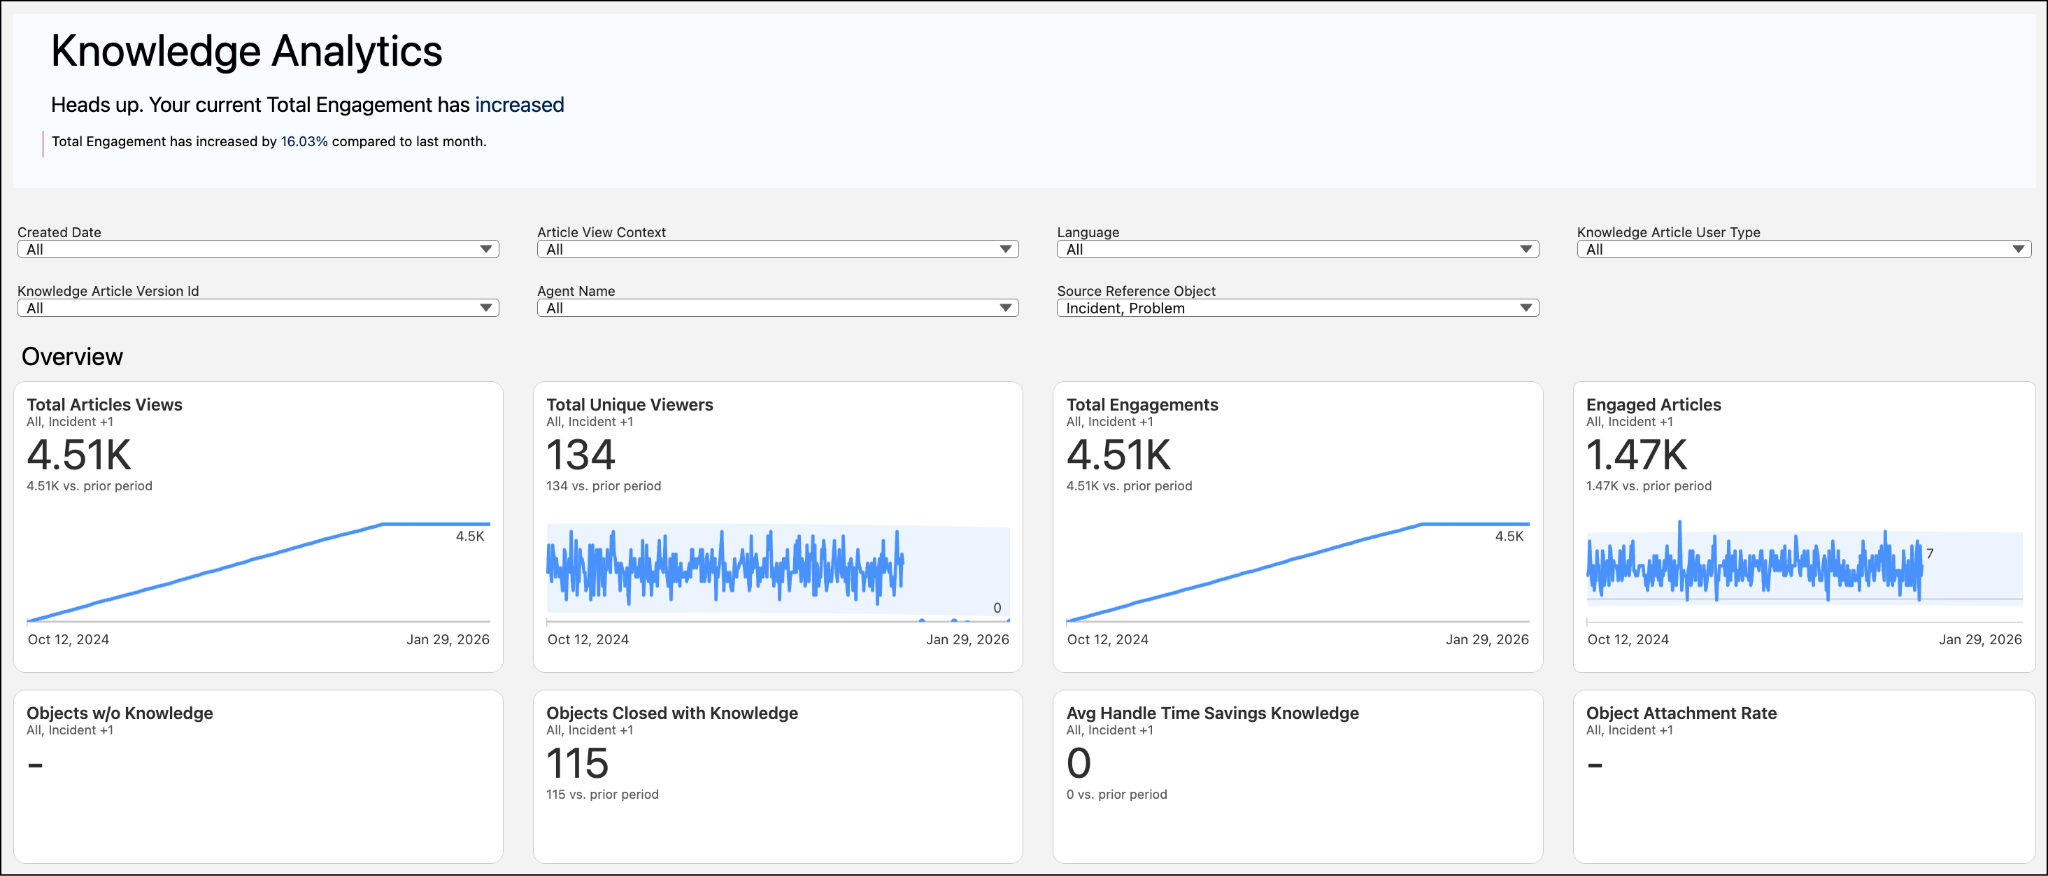
While your specific dashboard might vary, here are a few examples of the powerful metrics you can unlock to prove the ROI of your knowledge strategy. Notice that because you set your filter in the example above, the dashboard’s generic Object metrics automatically update to reflect your specific incident and problem workload.
-
Objects Closed with Knowledge: Tracks the exact number of incidents or problems that were successfully resolved with the help of a knowledge article. This proves the ROI of your library!
-
Objects w/o Knowledge: Highlights incidents and problems your team resolved from scratch without the help of an article. This is your go-to metric for spotting content gaps where new articles need to be written.
-
Average Handle Time Savings Knowledge: Shows the average time you saved when solving incidents and problems by using knowledge. This is your ultimate efficiency metric, proving the direct value of your team’s documentation efforts!

Be sure to check out the Unlock Actionable Data Insights with Tableau Next foundational trail to use Tableau Next for deeper insights!
Life at Orivian
At Orivian Global Holding—a diverse international conglomerate—the IT team uses key Knowledge Analytics metrics to spot trends at a high level, then drill down for more detail. Recently, Orivian resolved a global VPN outage and used AI to generate a known error and several FAQ knowledge articles. The crisis is over, but the IT manager wants to ensure the new articles are actually working and identify any other blind spots in their self-service strategy.
Let’s follow along as the IT team asks three critical questions to measure their success.
-
Are the new articles actually resolving issues? The manager checks the Objects Closed with Knowledge metric. The dashboard shows a sharp increase, proving that fulfillers are successfully attaching the new VPN troubleshooting guides to close out related incident records.
-
Are these articles saving us time? High usage is great, but efficiency is even better. The manager looks at the Average Handle Time Savings metric and discovers that incidents closed with the new VPN articles are resolved an average of 15 minutes faster than those resolved without them. This proves the direct ROI of their knowledge strategy!
-
Where are our remaining blind spots? This is the most powerful tool for proactive service. The manager analyzes the Objects w/o Knowledge metric. The data reveals a high volume of single sign-on (SSO) incidents being resolved from scratch, with zero knowledge articles attached. The manager immediately tasks a problem fulfiller with using Einstein to draft a new SSO Troubleshooting Guide to close the gap.
Continuous Improvement
Knowledge management isn’t a set-it-and-forget it process. It is a cycle that typically starts with employees, involves collaboration by IT team members, management, and also knowledge article curation over time. And don’t forget–articles that are published and consumed then generate new data for the dashboard and help ground AI for Agentforce IT Service as a whole.
By keeping this wheel turning, you ensure your AI agents have the latest data to deflect tickets and your human teams have the wisdom they need to solve complex problems faster. Essentially, continuous improvement with knowledge management is a positive feedback loop, not a negative spiral of frustration and rework.
Wrap Up
Congratulations! You’ve successfully navigated the lifecycle of knowledge management. You started by learning how a strong knowledge base acts as the foundational fuel for your AI and self-service channels. From there, you took the wheel in the Agentic IT Service Desk to find, filter, and manage your existing library.
When you spotted gaps, you learned how to fill them—both by manually crafting articles and by using generative AI to instantly draft solutions from your resolved incidents and problems. Finally, you saw how powerful analytics dashboards close the loop, proving the ROI of your hard work and highlighting exactly where to focus next.
By treating knowledge as a living part of your IT service process, you aren’t just closing tickets faster—you are building a smarter, more efficient organization. Now go forth and share that wisdom!
Resources
- Salesforce Help: Knowledge Analytics Dashboard in IT Service
- Salesforce Help: Report on Salesforce Knowledge Articles
- Salesforce Help: Work with Articles and Translations
- AgentExchange: Lightning Knowledge Dashboard