Share Insights with Dashboards
Learning Objectives
After completing this unit, you’ll be able to:
- Describe the use cases for each dashboard type in Supplier 360.
- Build and manage a custom dashboard by adding, editing, and removing widgets to keep visualizations accurate and current.
- Share a dashboard and apply best practices for communicating supplier data insights to stakeholders.
From Reports to a Dashboard
Sam has three findings for the procurement director:
- A record count baseline from the predefined reports
- A validation error spike flagged for investigation
- A state-wise supplier distribution with concentration in Louisiana, Arizona, and Michigan
Three reports. Three answers. But Sam can't send the procurement director to three separate report pages before the review.
What the procurement director needs is a single view that tells the supplier data story at a glance. That's what a dashboard does.
This unit covers how dashboards work in Supplier 360 SaaS and how to build one that communicates findings clearly. You'll also learn how to share dashboards so the right people view the right data without needing to navigate the system themselves.
Two Types of Dashboards
Supplier 360 SaaS includes two types of dashboards, and each serves a different purpose.
Predefined
These dashboards are built and managed by your administrator. You can't edit them, but you can add them to your Home page to monitor key system metrics such as match job performance and usage statistics.
To add a predefined dashboard:
- Select Add on the Home page.
- Select Add Existing Dashboard.
- Go to the Predefined Dashboards tab.
- Select the dashboard.
- Select Add.
Custom
These dashboards you create yourself. You choose the layout, add report charts as widgets, and share them with colleagues. Sam's procurement review dashboard is a custom dashboard.

Create a Custom Dashboard
Sam needs to create a new dashboard for the quarterly review.
When you log in for the first time, the Home page has an empty dashboard. There are two ways to create a custom dashboard.
- On the Home page, select New Dashboard.
- Select New | Reports and Dashboards | Dashboards | Create.
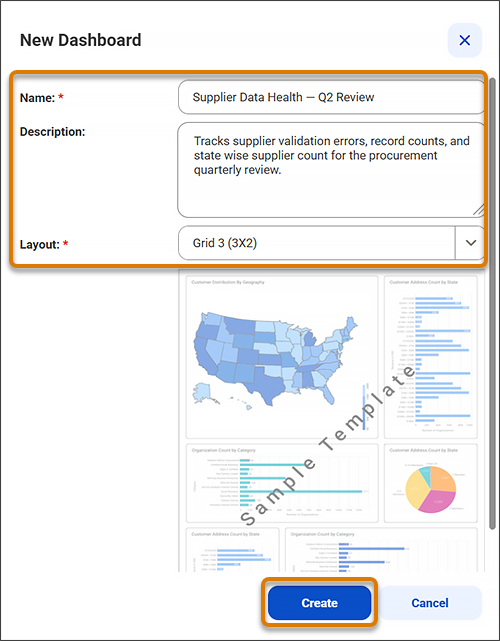
The New Dashboard dialog box appears. Sam provides a name and description of the dashboard.
-
Name: Supplier Data Health—Q2 Review
-
Description: Tracks supplier validation errors, record counts, and statewise supplier count for the procurement quarterly review
Sam selects a layout. Each layout is a predefined grid arrangement that determines how many widget slots the dashboard has.
Layout |
Description |
|---|---|
Default Grid |
1 large grid + 10 standard grids: good for one featured chart with supporting detail |
Grid 1 (4x3) |
4 rows of 3 grids: good for dense data across many widgets |
Grid 2 (4x2) |
4 rows of 2 grids: good for paired comparisons |
Grid 3 (3x2) |
3 rows of 2 grids: compact side-by-side view |
Grid 4 (2x3) and (1x2) |
2 rows of 3 + 1 row of 2: good for a mix of summary and detail views |
Grid 5 (8 Grids) |
2 long + 2 wide + 4 standard grids: good for a variety of chart sizes |
Grid 6 (6 Grids) |
2 large + 4 standard grids: good for two featured charts with supporting context |
Sam picks Grid 3 (3x2), which creates two rows of three charts, plus a summary strip. After Sam creates the dashboard, it opens with empty widget slots ready to fill.
Add Widgets to Tell the Data Story
Each grid slot in the layout is an empty widget. Sam must add at least one widget for charts to appear on the Home page.
To add a widget to the dashboard:
- Select Edit to open the dashboard in edit mode.
- Select Add Report on the first widget slot.
- In the dialog box, review the available reports.
- Select the State wise Supplier Count custom report from the list. A chart preview appears.
- Select Add.
Sam repeats this for the remaining widgets, and adds these reports.
-
Number of Valid Records by Business Entity: The predefined report that shows the validation error distribution
-
Number of Records by Business Entity: The predefined report that gives the total supplier and contact record count baseline

Sam saves the report. The dashboard is now live on the Home page.
Reports and Dashboards Demo
Before you build your own, check out how it's done. This demo provides step-by-step instructions you can use to build reports and dashboards.
View and Interpret Dashboard Data
Before the quarterly review, Sam opens the dashboard from the My Dashboards tab on the Reports and Dashboards page. The charts load with the most recently scheduled data.
This is the key difference between a widget and a report—a widget gives you a visual summary, and when you select View you get the full data context behind it.

Keep Widgets Accurate and Current
After the quarterly review, the procurement director asks Sam to replace the state wise supplier count widget with a supplier type breakdown. That's the new priority for Q3 planning.
To edit the widget:
- Open the dashboard.
- Select Edit to enter edit mode.
- To change the dashboard's name or layout, select Edit Properties.
- Update the fields in the dialog box, and select Update.
To replace the merge history widget:
- Select the widget.
- Select the new supplier type report from the report list. The chart preview updates immediately.
- Select Save.
To remove a widget entirely, Sam selects the widget in edit mode and then selects Remove. The layout adjusts automatically.
Share, Add to Home, or Delete
Sam's dashboard is currently private, so only Sam can view it. To make it useful for the procurement director, Sam needs to share it.
To share a dashboard:
- From the My Dashboards tab, select the dashboard.
- Select Share.
- Choose Yes, share with everyone.
To add a dashboard to your Home page:
- Go to the My Dashboards tab.
- Select Actions | Add to Home. This is useful when a colleague shares a dashboard with you but didn't add it to everyone's Home page.
To delete a dashboard:
- Go to the My Dashboards tab.
- Select Actions | Delete and confirm the deletion. The dashboard is removed.
The Bigger Picture
Sam closes the quarterly review with answers the procurement director didn't have to ask for twice. Three reports. One dashboard. The supplier data story was told clearly and on time.
You've now gone through the full lifecycle of master data management. You learned what MDM SaaS does and which domain fits your business. You learned how to bring data in cleanly, govern it through match and merge rules, and validate it against your organization's standards. You also learned how to navigate supplier relationships through hierarchies, and surface the quality and completeness of your master data through reports and dashboards that make it accessible to the people who act on it. Each step builds toward a single capability—turning raw, fragmented business data into a trusted, decision-ready asset.