Reveal the Search and Revenue Relationship with the Search Conversion Dashboard
Learning Objectives
After completing this unit, you'll be able to:
- Explore the role search plays in a positive storefront experience.
- Describe the Search Conversion dashboard.
- Define the Search Conversion metrics.
- Explain how the search conversion metrics offer insight into on-site search strategy performance.
- Describe how B2C Commerce categorizes visits and attributes orders to search terms.
- Identify the data limits of the Search Conversion dashboard and how they affect your analysis.
Explore the Search Conversion Dashboard
On-site search is an essential part of a successful ecommerce merchandising strategy. As a merchandiser, you know that by integrating your search strategy into your merchandising approach you can take advantage of how shoppers use search. You want to make sure that your storefront search strategy converts shopper searches into orders and revenue.
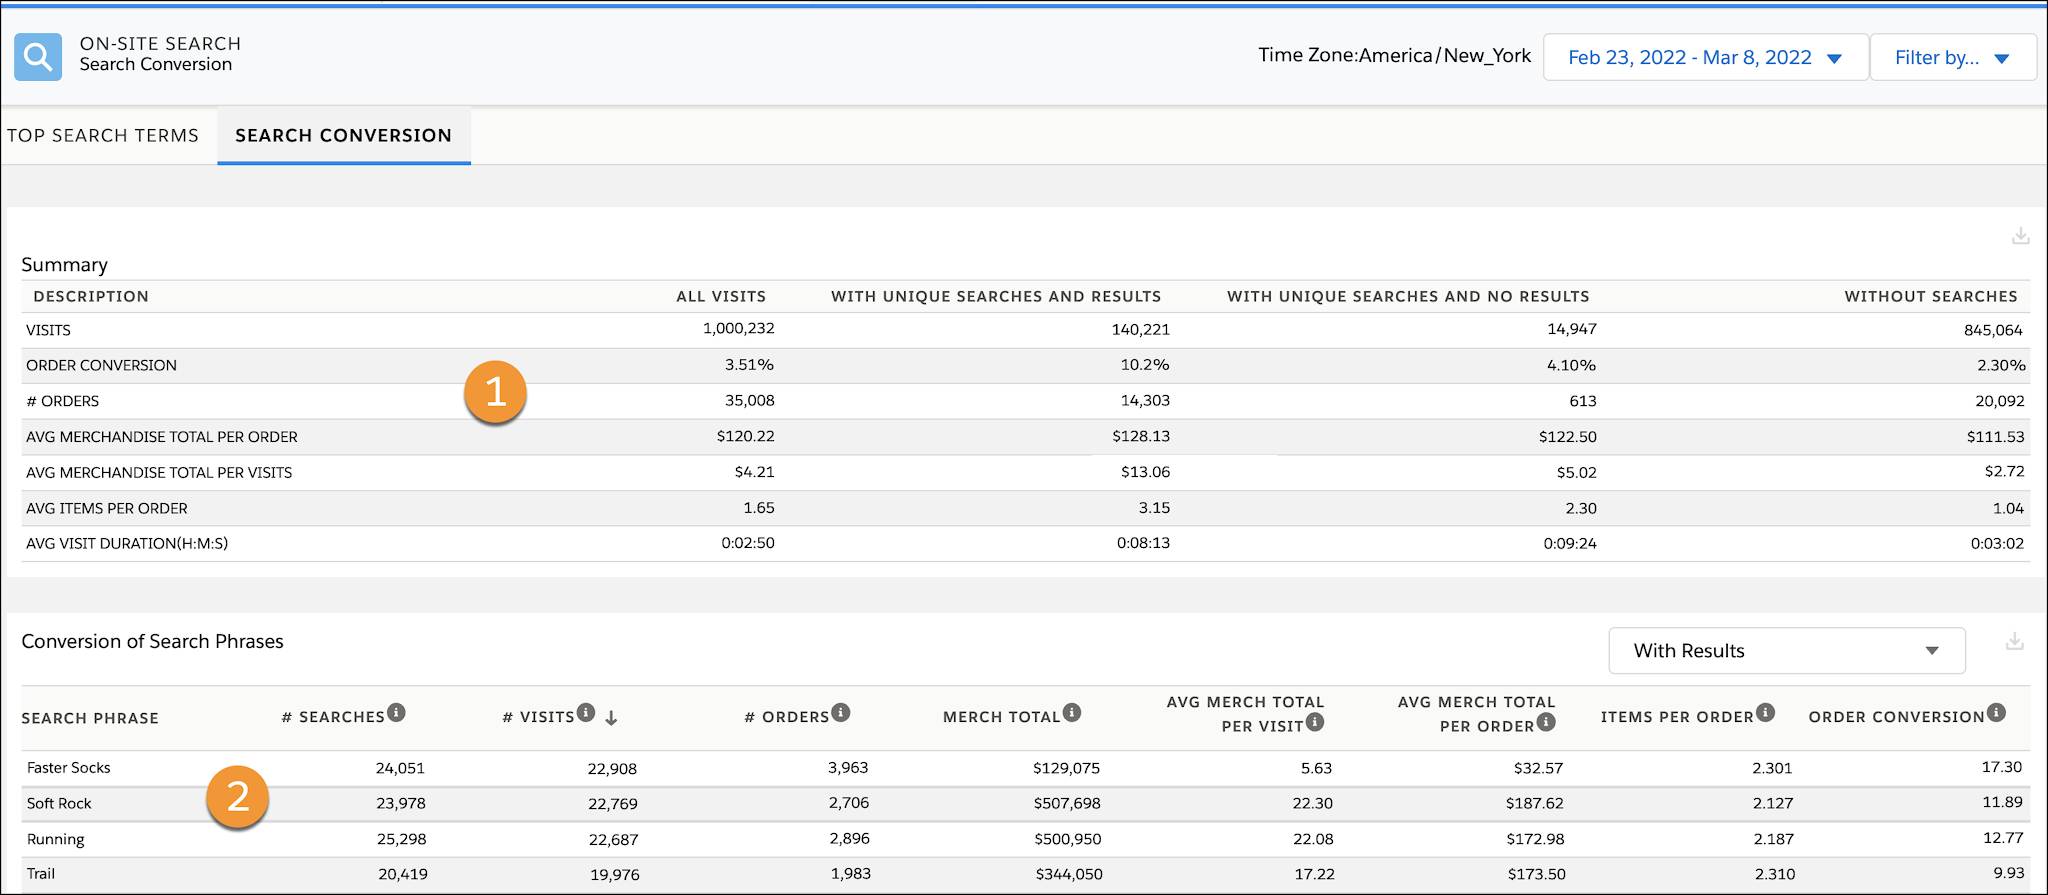
To track how well that strategy converts search to orders, you use the Agentforce Commerce for B2C Search Conversion dashboard. This dashboard organizes search conversion metrics into two views:
-
Summary table: A summary of aggregate search conversion metrics
-
Conversion of Search Phrases table: A detailed search term data. Each view answers a different question about search behavior, so treat them as separate perspectives rather than cross-checking one against the other.
Know the Rules Before You Read the Data
Before you dig into the numbers, get familiar with a few rules that shape what the dashboard shows you.
B2C Commerce sorts every visit into one of three categories: visits with unique searches and results, visits with unique searches and no results, and visits without searches. A visit with a mix of successful and unsuccessful searches counts only in the with-results category, even when some of its searches returned nothing. That means the no-results view doesn't add up to the summary totals when you cross-check them directly.
Order attribution works on its own logic too. When a shopper places an order, B2C Commerce attributes the order's value to every unique search term used earlier in that visit. If a shopper searches for shoes and then sneakers before ordering, the order value shows up in the detail table for both terms. Because of this accounting process, the sum of order values in the Conversion of Search Phrases table exceeds the total order value in the Summary section over time. After a shopper places an order, their next search starts a new search session.
Two data limits shape the Conversion of Search Phrases table. It includes only the top 10,000 search terms per day, so very low-frequency terms drop off on high-traffic sites. A CSV export caps out at 25,000 entries, worth weighing when you pull data across several months.
Given these rules, use the Summary view for high-level trends and the Conversion of Search Phrases table for individual search terms. Treat the two as separate lenses on your search data, not a single reconciled dataset.
Search Conversion Summary Metrics
The Summary section gives you insight on how search converts to orders across your site, broken into the three visit categories described above. Metrics cover the time period set in the dashboard.
This table describes the Search Conversion Summary table. All metrics are calculated for the time period set in the dashboard.
Metric |
Description |
|---|---|
Visits |
All Visits: The total number of site visits during the time period. With Unique Searches and Results: The number of site visits during which one or more searches returned results. With Unique searches and No Results: The number of visits during which all searches returned no results. Without Searches: The number of visits without a search. A site visit with a unique search can have multiple searches with multiple results attributed to the visit. When this is the case, the visit is counted as a single visit with search results. New search terms, searched after a placed order, count as a new search visit. Use the Visits summary metrics to assess how often shoppers use search on your site and how effective your search strategy is at returning search results. For example, a consistent trend that shows high levels of searches and no results can indicate the need to update search dictionaries so that they include current and relevant search terms. |
Order Conversion |
All Visits: The order conversion rate for all visits With Unique Searches and Results: The order conversion rate of visits with searches results. With Unique searches and No Results: The order conversion rate of visits with searches without results. Without Searches: The order conversion rate of visits without a search. Use the order conversion rate metrics to evaluate the order conversion impact of your search strategy by comparing conversion rates to your conversion goals. You determine, for each metric, the conversion rate that reflects success for your search strategy. For example, an effective strategy shows the conversion rates that meet or exceed your goals for each metric. Metrics that show search conversion rates below expectations can indicate that a change in search settings is needed. Viewed as an isolated metric, the conversion rate can be misleading. For example a high conversion rate for a low number of searches may not provide a large enough data sample from which to draw conclusions. Best practice for drawing conclusions from the conversion rate is to correlate results with other summary metrics such as number of orders and merchandise per order. |
# Orders |
All Visits: The total number of orders placed during all visits. With Unique Searches and Results: The number of orders placed during visits with search results. With Unique searches and No Results: The number of orders placed during visits without search results. Without Searches: The number of orders during visits without a search. Use these metrics to review the number of orders placed for each search result category. A large number of orders can be misleading if the average order value is below expectations. For example, the results for orders placed from searches with results are high. However, many of the orders are linked to a promotion on small value products and the revenue generated from those orders doesn’t meet sales goals. |
Avg. Merchandise Total per Order |
All Visits: The average merchandise value of orders from all visits. With Unique Searches and Results: The average merchandise value from orders attributed to visits with search results. With Unique searches and No Results: The average merchandise value from orders attributed to visits without search results. Without Searches: The average merchandise value from orders attributed to visits without a search. Use these metrics to review the value of the orders placed for each search category. |
Avg Merchandise Total per Visit |
All Visits: The average Total Merchandise per site visit.
With Unique Searches and Results: The average merchandise value per visit with search results. With Unique searches and No Results: The average merchandise value per visit without search results. Without Searches: The average merchandise value per visit without a search. Use these metrics to evaluate how in terms of merchandise value, shoppers respond to search results during the time period. Check for results that meet your sales goals. For example, historical data for your site shows shoppers who search for a product or promotion are more likely to place an order. In this case, you can expect to see a higher merchandise average for visits with search results than with other types of visits. |
Avg Items per Order |
All Visits: The average number of items per order across all visits. With Unique Searches and Results: The average number of items per order attributed to a search with results. With Unique searches and No Results: The average number of items per order attributed to searches without results. Without Searches: The average number of items per visit without a search. Use the results in these metrics to review how on-site search can influence the number or items added to an order. For example, if you design your search results to showcase products with companion products or accessories and average items per order value that is higher than expected. You can conclude that your search results are influencing additional purchases. |
Avg Visit Duration |
All Visits: The average duration of a visit. With Unique Searches and Results: The average duration of a visit with search results. With Unique searches and No Results: The average duration of a visit without search results. Without Searches: The average duration of a visit without a search. Use these metrics to compare visit duration for each type of visit. Evaluate the durations to see if expectations are met. For example, you expect search visits with results to direct shoppers to other products and offers that extend their visit duration. |
Explore Conversion of Search Phrases Metrics
In addition to the Summary Conversion table, the Search Conversion dashboard also shows the Search Phrase Conversion table. This table lists the search phrases used by shoppers during the time period. You can configure the table to show search phrases with results (default) or search phrases without results. Use the dropdown to select search phrases with results or search phrases without results.
This table describes the metrics available to help you evaluate the performance of a search phrase.
Metric |
Description |
|---|---|
Searches |
The number of times shoppers searched the phrase. |
Visits |
The number of visits during which shoppers searched the phrase one or more times. Compare this to # Searches for the same phrase. A wide gap in the results view can point to a weak match between the phrase and your catalog. The same gap in the no-results view can mean shoppers keep trying the term expecting a different outcome. Add popular no-result phrases to your Search Dictionaries. |
Orders |
The number of orders placed during visits with a search for this phrase. Order count alone doesn't speak to revenue, so pair it with merchandise total. |
Merchandise Total |
The value of orders placed during visits that include a search with this phrase. |
Avg. Merchandise Total per Search |
Merchandise Total divided by # Searches. |
Avg. Merchandise Total per Order |
Merchandise Total divided by Orders. |
Items per Order |
Total units sold in visits with at least one search for the phrase, divided by Orders. |
Order Conversion |
Orders divided by Visits for the phrase. |
Evaluate Metrics
Now you’re ready to look at search conversion data and see how a fine-tuned search strategy translates to search conversion. For that, you use the Search Conversion view of the On-Site Search dashboard. To open the dashboard, select the Search Conversion tab. For the examples in this unit, we look at the past two weeks of search data for the athletic shoe retailer.
Search Conversion Summary Table
The Summary table gives you a quick overview of how effective your search strategy is at converting searches into orders. When you review the summary, these metrics stand out.
- The order conversion rate for searches with results is 10.2%. That’s an improvement of 5% over last month’s figures and a solid indicator that the new search strategy is working (1).
- The visits from searches with results column shows a higher average merchandise per order value, and higher average items per order than the other types of visits listed in the table. These results point to an improvement in your on-site search strategy. A strategy that includes Agentic Commerce Search and Einstein search recommendations. Both provide AI-driven personalized search recommendations to shoppers in real time (2).
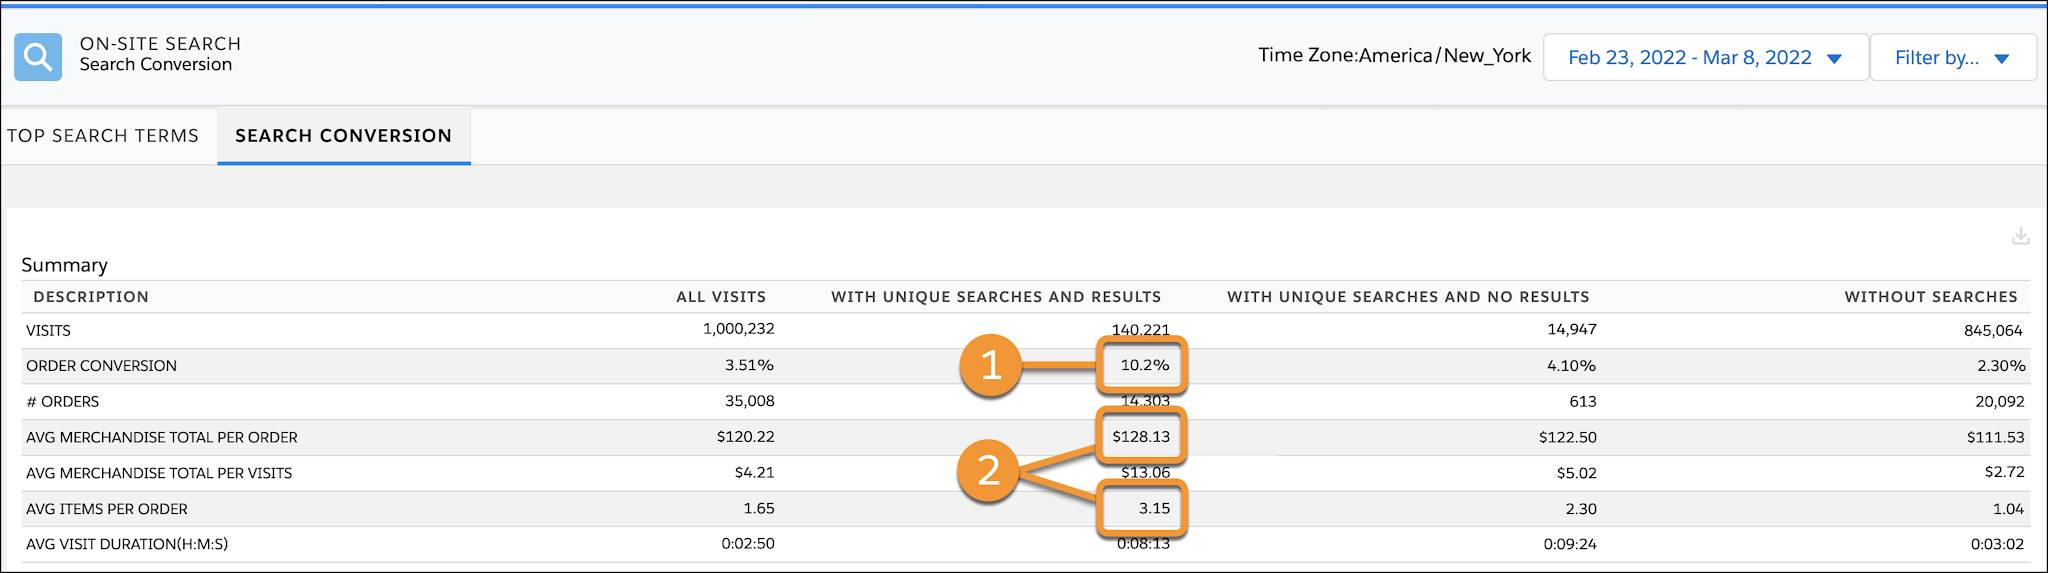
As an experienced merchandiser, you know that when visits-without-search drops below the baseline, it signals that it's time to revisit your strategy. Today the numbers hold up well and you’re pleased with the performance they show.
Conversion of Search Phrases Table
Next, you review the Conversion of Search Phrases table. The default data view lists search phrases with results by number of visits, in descending order (1). You can modify the data presentation with the column sorting options. And you can use the table dropdown to change the view from search phrases with results to search phrases without results (2).
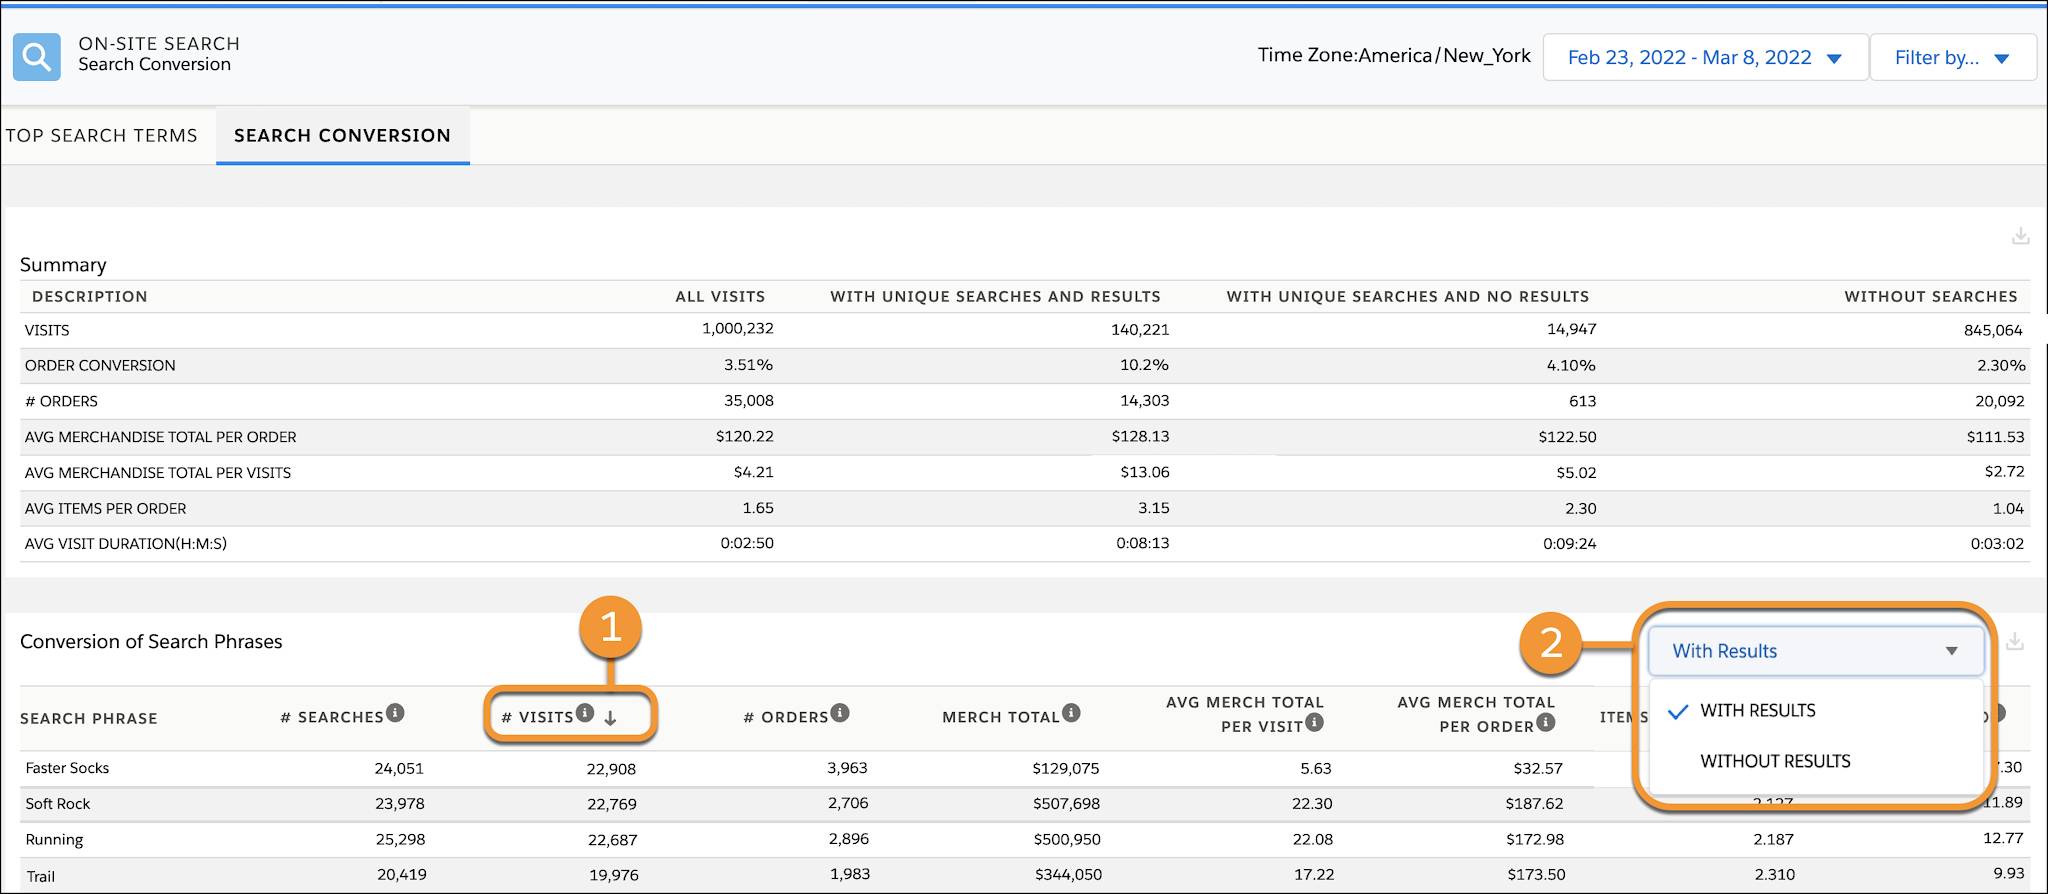
As you review the metrics for search phrases with results, these metrics catch your attention.
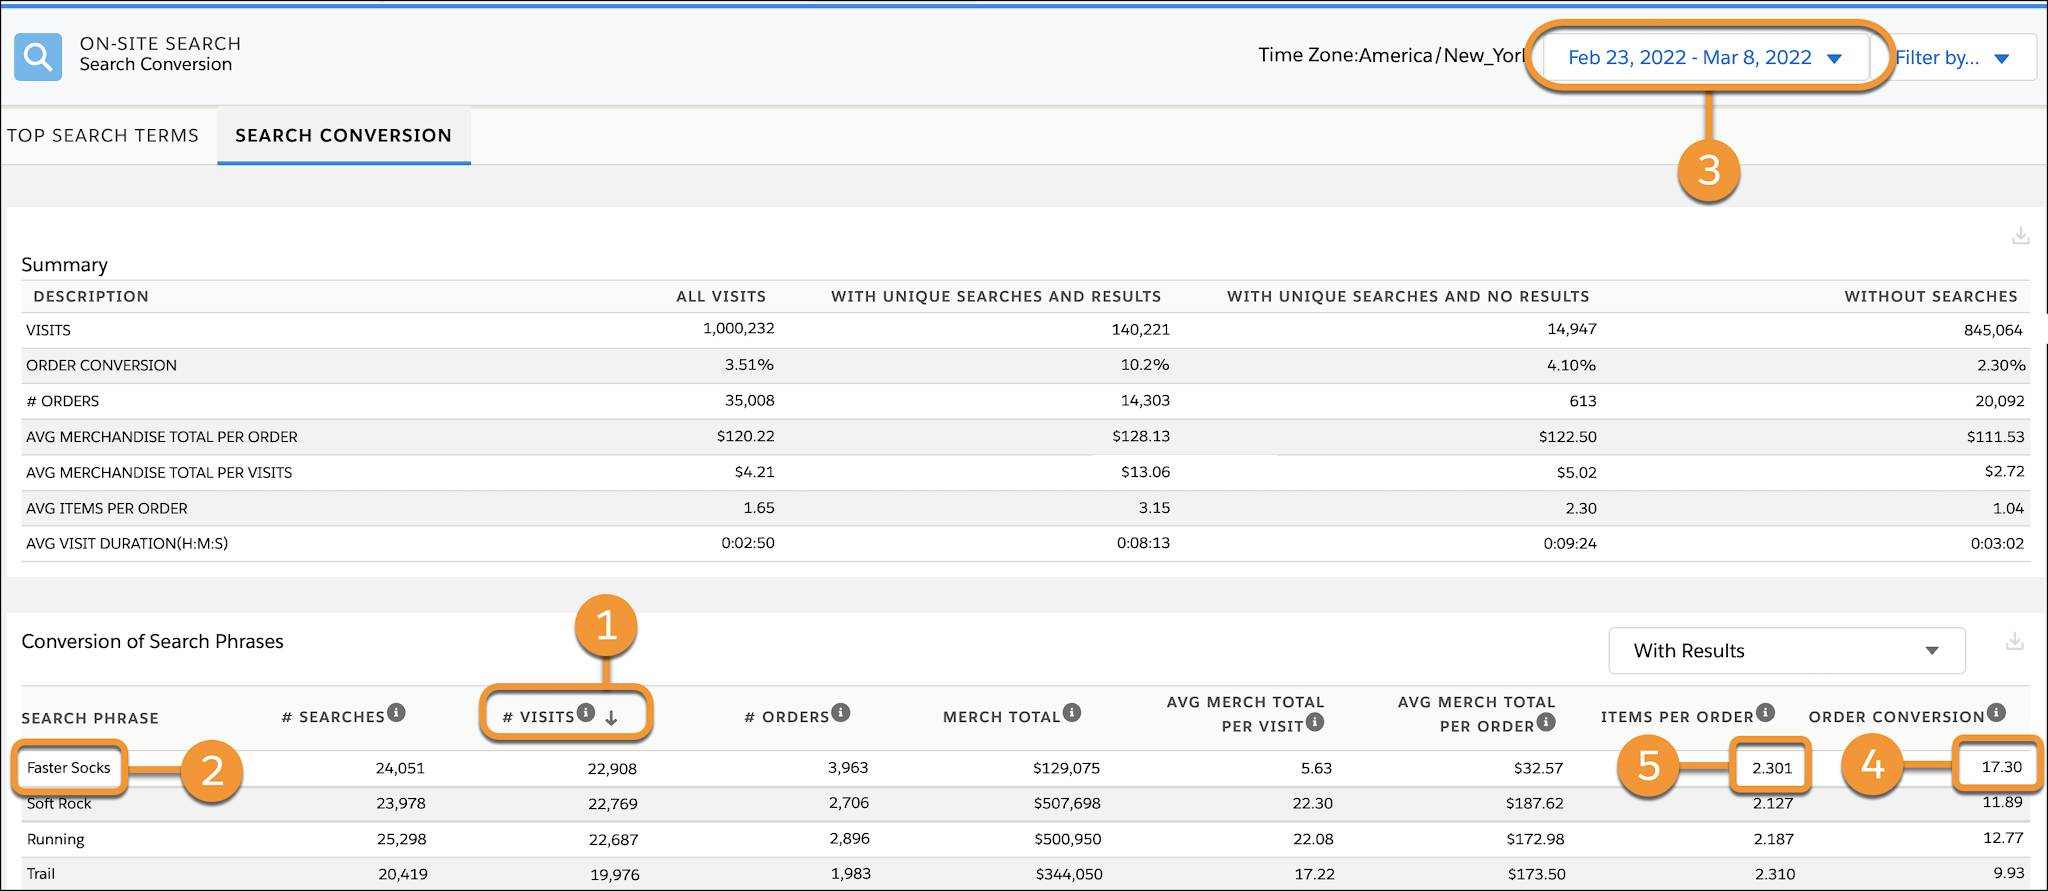
- When sorted by number of visits (1), FasterSocks is the top search phrase (2). You expect this result because the dashboard date range coincides with the dates during which you ran a FasterSock BOGO promotion (3).
- The other conversion metrics for FasterSocks are also impressive, including an order conversion rate of 17.3 percent (4), and items per order at 2.3 (5). These numbers outpace your 2-week average.
Later, you can review the sales and product numbers. But, the conversion metrics show that the BOGO promotion is likely responsible for shoppers adding both qualifying products and regular priced merchandise to their carts and placing orders. Nice!
- When you sort search phrases by merchandise total (1), Soft Rock, the name of your company’s newest trail-runner shoe, is the top search phrase (2). That’s a good result and on target with your marketing plan.
- In addition, the conversion rate for Soft Rock search is 11.89% (3). Your team has been running a campaign to promote the Soft Rock Trail-Runner. These search conversion results show that the product name is gaining traction with customers, and searches for Soft Rocks are converting to orders.

Review Search Phrases Without Results
You can also use the Search Phrase Conversion table to review conversion rates and the use of search phrases without results.
From the Search Phrase Conversion table dropdown, select without results. The table lists the search phrases that didn’t return results. This view can provide valuable insight into the assessment of your strategy. It shows missed opportunities to engage with shoppers, and it gives you a view of the products customers are looking for on your site.
From the Without Results listing, you see a few interesting results to research.
- The search phrase Water Shoes (1) is the top 10 search phrases used without results (2). Your company doesn’t sell water shoes, but shoppers did place orders when using the search phrase. Later you can dig deeper into the Sales and Product dashboards to unveil the mystery. In the meantime, you inform the Product Development team about the interest in water shoes, while you dig into your inventory to find products you can match with the phrase.

- The search phrases designer colors and cushion are also the top search phrases without results. Because these search terms are generic, you take advantage of their popularity. You ask your team to identify products that match with the phrases and add them to the appropriate search dictionary.

The on-site search results for your company show that changes made to your search strategy are working. But, the results also identify a few areas where you can improve your metrics with minor adjustments. Overall, your search strategy is improving the storefront search experience, and helping increase revenue. Keeping on-site search relevant and up to date is a critical part of a successful shopper experience. The On-Site Search dashboards and metrics are key to maintaining a successful on-site search strategy.
Wrap It Up
In this unit, you learned how to evaluate your search strategy's impact on orders and revenue by using the Search Conversion dashboard's summary and phrase-specific metrics. You also learned to interpret visit categorization rules, attribution models, and data limits to ensure that you draw accurate conclusions from your conversion data.
This badge provides a comprehensive overview of the On-Site Search dashboards in Agentforce Commerce, teaching you to monitor search activity and engagement via the Top Search Terms dashboard and assess how that activity drives business value with the Search Conversion dashboard. Together, these tools help you to optimize your storefront search strategy, to improve the shopper experience, and to increase conversions.
Resources
- Salesforce Help: Search Indexes
- Salesforce Help: Commerce Cloud Einstein Search Dictionaries
- Trailhead: Salesforce B2C Commerce Storefront Search
- Salesforce Help: Reports & Dashboards
- Salesforce Help: Reports & Dashboards Feature Set