Evaluate Your On-Site Search Strategy with the Top Search Dashboard
Learning Objectives
After completing this unit, you'll be able to:
- Explain how the On-Site Search dashboard metrics help you evaluate your storefront search strategy.
- Describe the Top Search dashboard metrics, including Click-Through Rate.
- Describe how Top Search metrics offer insight into search strategy performance.
- Analyze and evaluate sample Top Search dashboard metrics.
- Go to the On-Site Search dashboard and filter its reports by site, date range, and device type.
- Update your search dictionaries and search index based on search phrase performance.

Explore the On-Site Search Dashboards
As you work through this badge, place yourself in the lead merchandiser role for a high-end athletic sneaker retailer. You and your team maintain the on-site search strategy for your storefront. You use Agentforce Commerce for B2C search features, including Agentic Commerce Search, and Einstein search recommendations. These tools help you keep search relevant for shoppers. To learn how to configure and deploy a search strategy, take the Salesforce B2C Commerce Storefront Search trail.
Maintaining a successful on-site search strategy is a continuous process. An effective strategy is agile and responds to shopper search requests, so you review search performance on your ecommerce site regularly.
For search metrics you can trust, you turn to the Agentforce Commerce for B2C Reports & Dashboards and use the On-Site Search dashboard. On-Site Search organizes search metrics into two dashboards.
-
Top Search Terms: Graphs and tables that report on search frequency, search phrase use, and revenue attributed to search results.
-
Search Conversion: Metrics that focus on how on-site searches convert to orders and revenue.
To improve the on-site search experience for your shoppers, you use the data in these two dashboard reports. Your goal: when a shopper enters a search term, they find a product, content asset, promotion, or page that improves their buying experience and increases the likelihood they place an order.
Optimize On-Site Search Performance with the Top Search Term Reports and Metrics
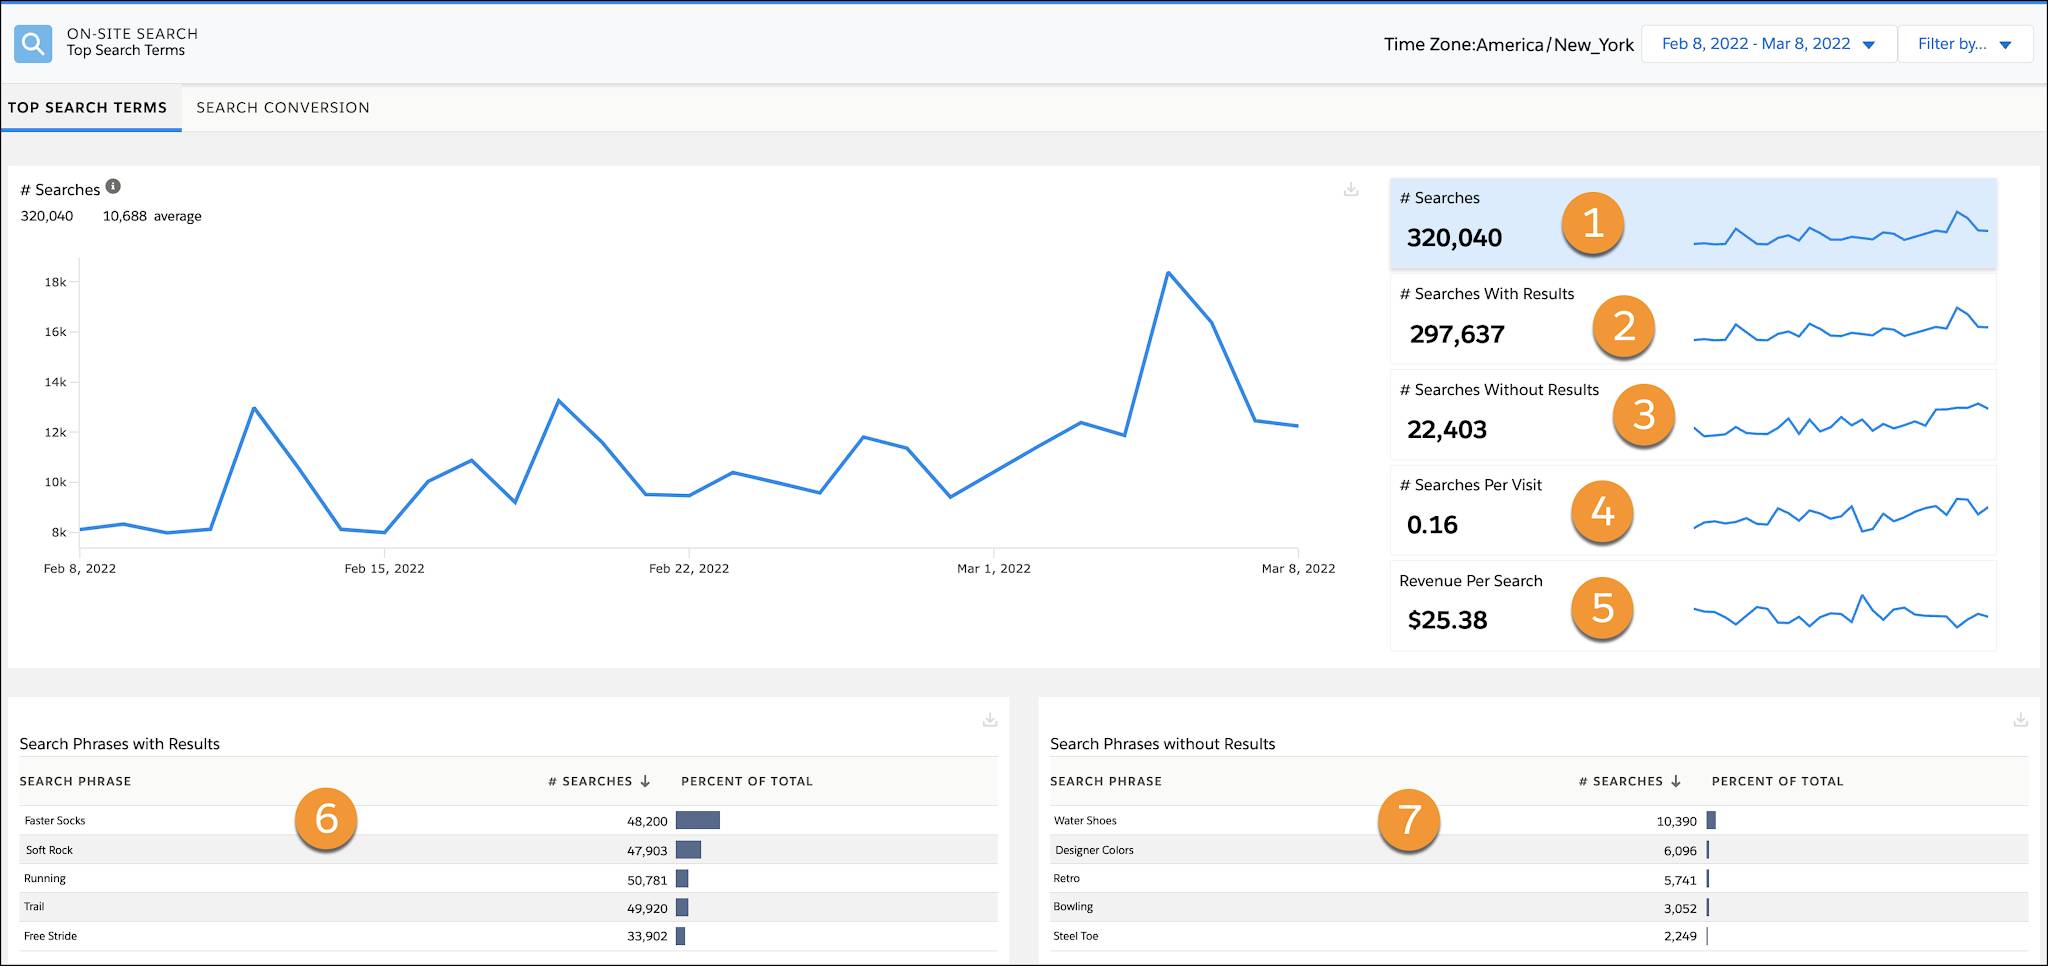
The Top Search Term dashboard uses graphs and tables to illustrate and collate search metrics. Search activity is a good indicator of how shoppers engage with your site. This table describes the Top Search Term dashboard and how you use its metrics to improve the customer search experience.
Filter these reports by site, date range, and device type (desktop, phone, tablet, and unknown) to zero in on the data that matters to your review.
Table or Graph |
Description |
|---|---|
Searches |
Shows the total and average daily number of searches during the time period, plotted by day. Look for trends such as peak use during sales, promotions, and holidays, and plan your strategy around them. For example, when searches trend upward during a promotion, sort categories with promotion-relevant products at the top. |
Searches with Results |
Shows the total and average daily number of searches with results. Each search during a visit gets tracked, so one visit can include multiple searches. A number close to the total searches count signals an effective search configuration. A lower number points to a stale search index or missing search term optimization in your dictionaries. |
Searches Without Results |
Shows the total and average daily number of searches without results. A low number signals a well-optimized strategy; a high number points to outdated search dictionaries and index entries. Cross-reference these phrases with Search Phrases Without Results, and add missing terms for products you sell to your search index. Use searches for products you don't carry to inform your wider business strategy. |
Searches per Visit |
Shows the average searches per visit, calculated as Number of Searches/Number of Visits. A high number points to product placement or navigation issues, such as shoppers searching for a popular product because they can't find it while browsing. |
Revenue per Search |
Shows the average total site revenue per search, calculated as Total Site Revenue/Number of Searches. Cross-reference this average with the average merchandise total per visit on the Search Conversion dashboard to gauge search's impact on total site revenue. |
Search Phrases with Results |
Lists the top five search phrases that returned results, with search counts and the percentage of all searches that returned results. Use these phrases to identify shopper favorites, and consider a promotional campaign or a prominent content slot for related products. Note expected phrases that aren't listed, and remove unused phrases from the search index to manage its size. |
Search Phrases Without Results |
Lists the top five search phrases that didn't return results, with search counts and the percentage of all searches that didn't return results. Update your searchable product attributes and search index with these phrases to close the gap. |
Click-Through Rate |
Tracks how often shoppers click a search result after entering a query, measuring engagement quality rather than raw volume. Use CTR data to spot high-volume terms with low engagement, find queries that return results but attract no clicks, compare click behavior across time ranges and filters, and prioritize relevance tuning, synonyms, sorting, and merchandising rules for underperforming terms. |
Evaluate On-Site Search Top Search Terms Performance
For the past few months, your site has experienced a drop in the number of total searches and searches with results, while the number of searches without results has gone up. To address these metrics, your team implements a new on-site search strategy. The strategy takes advantage of the search features and settings available in Business Manager and Einstein search recommendations.
In addition to the advanced search capabilities of Einstein predictive search, you also review metrics available on the Top Search dashboard to help your team refine their search strategy. You review search performance metrics and the search terms shoppers use on your site. You use the dashboard data to keep your site’s search index, dictionaries, searchable product attributes, and other search configurations updated. You want to make sure that products and content search results are relevant for popular search phrases.
To access the On-Site Search dashboard:
- In Business Manager, select App Launcher, then select Merchant Tools| Analytics | Reports & Dashboards.
- Select the On-Site Search tab. The dashboard defaults to Top Search reports.
To conduct your review, you select the On-Site Search tab (1).

With search playing a key role in your merchandising strategy, you want to review search data for the past month. You're looking for data on how many searches your site hosts, how many return results, and how many searches happen per visit.
You set the Top Search dashboard date range for the past 30 days.
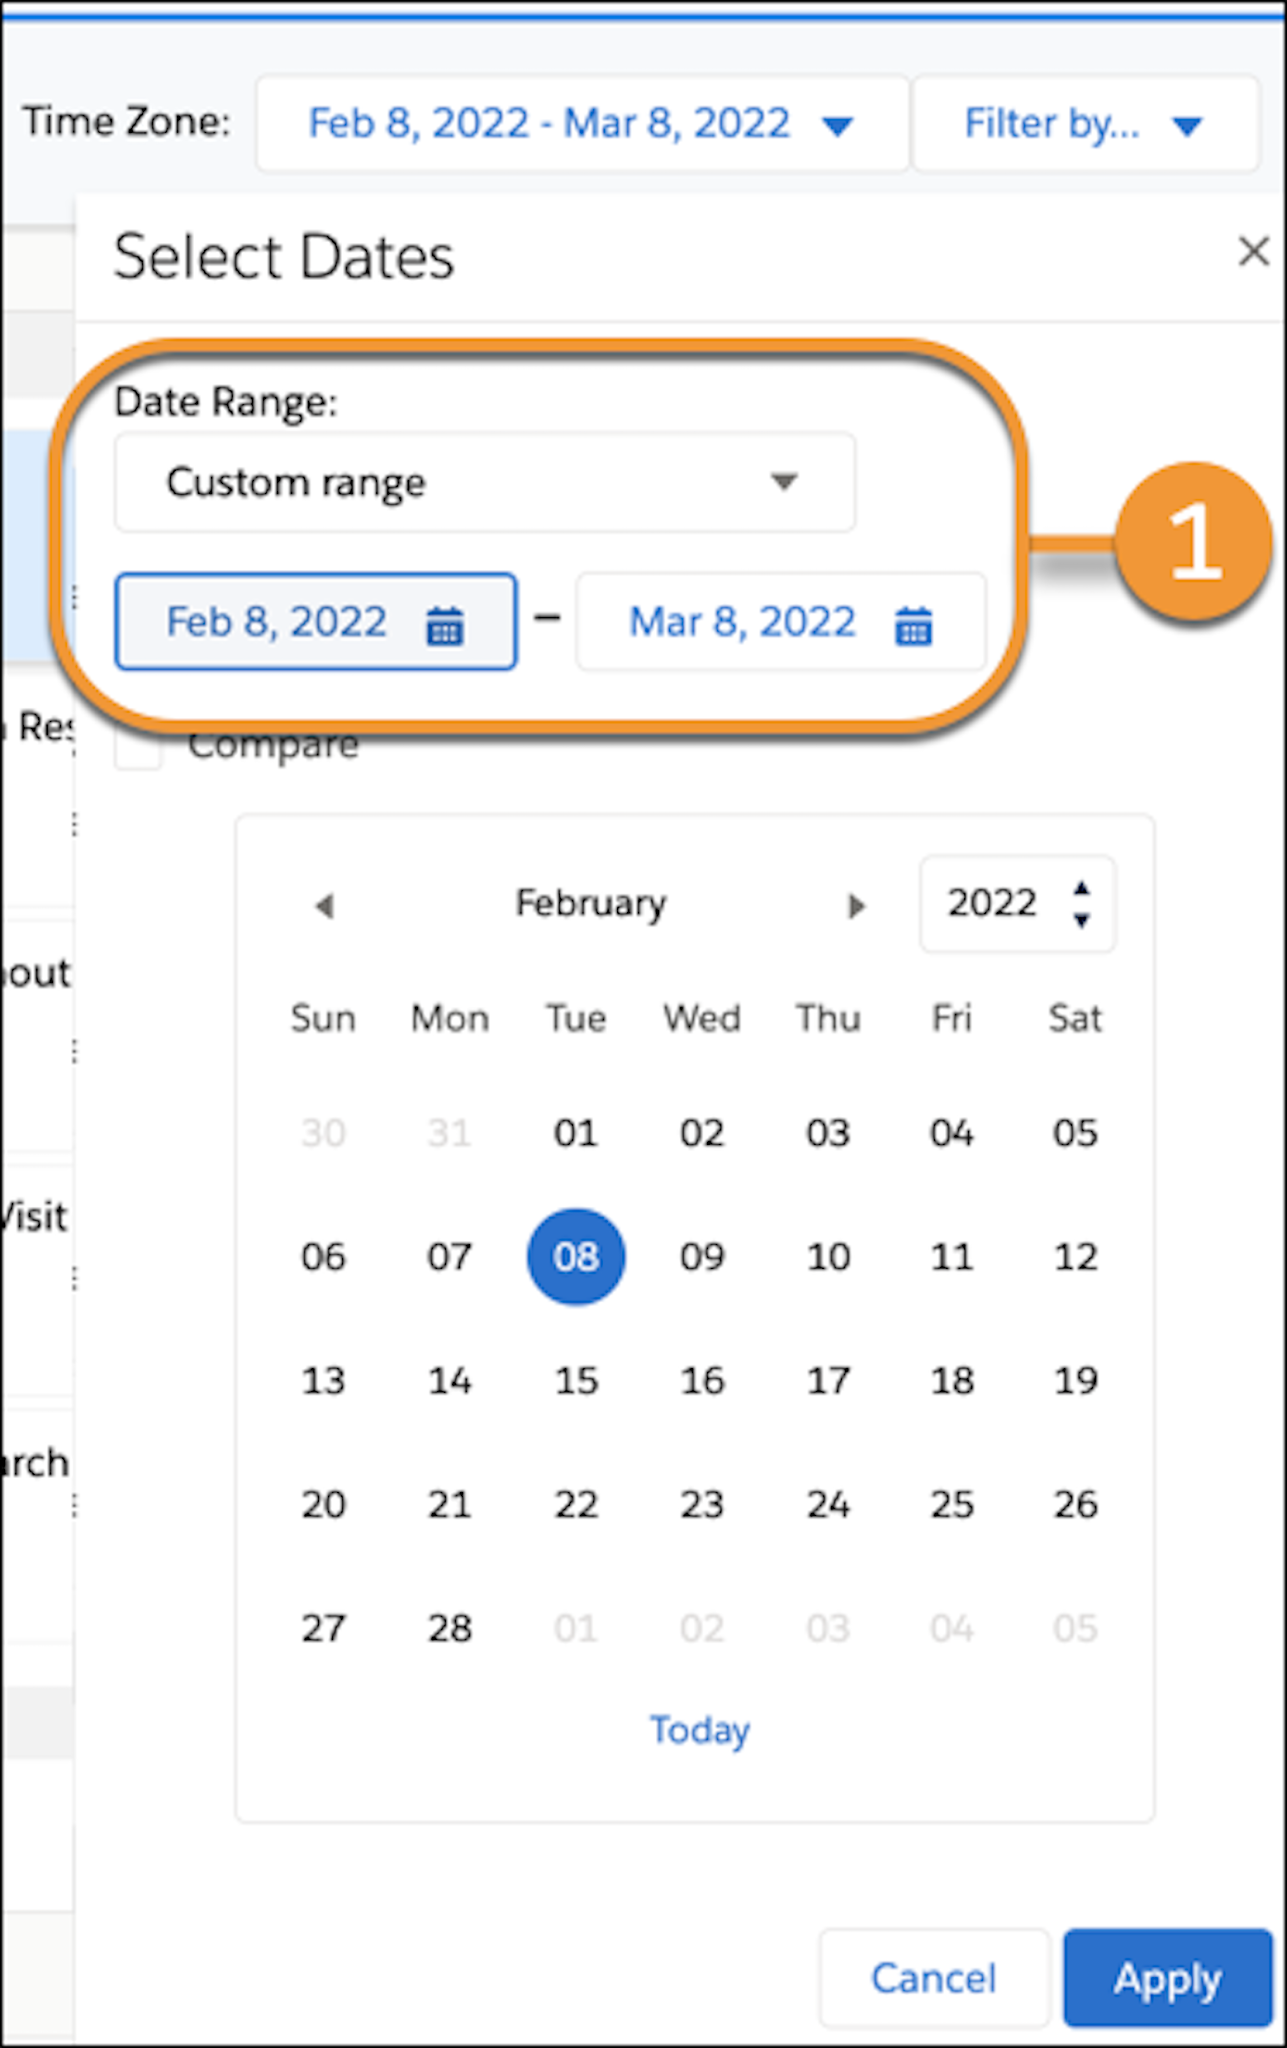
- Select the date dropdown.
- Select the date range (1).
- Select Apply.
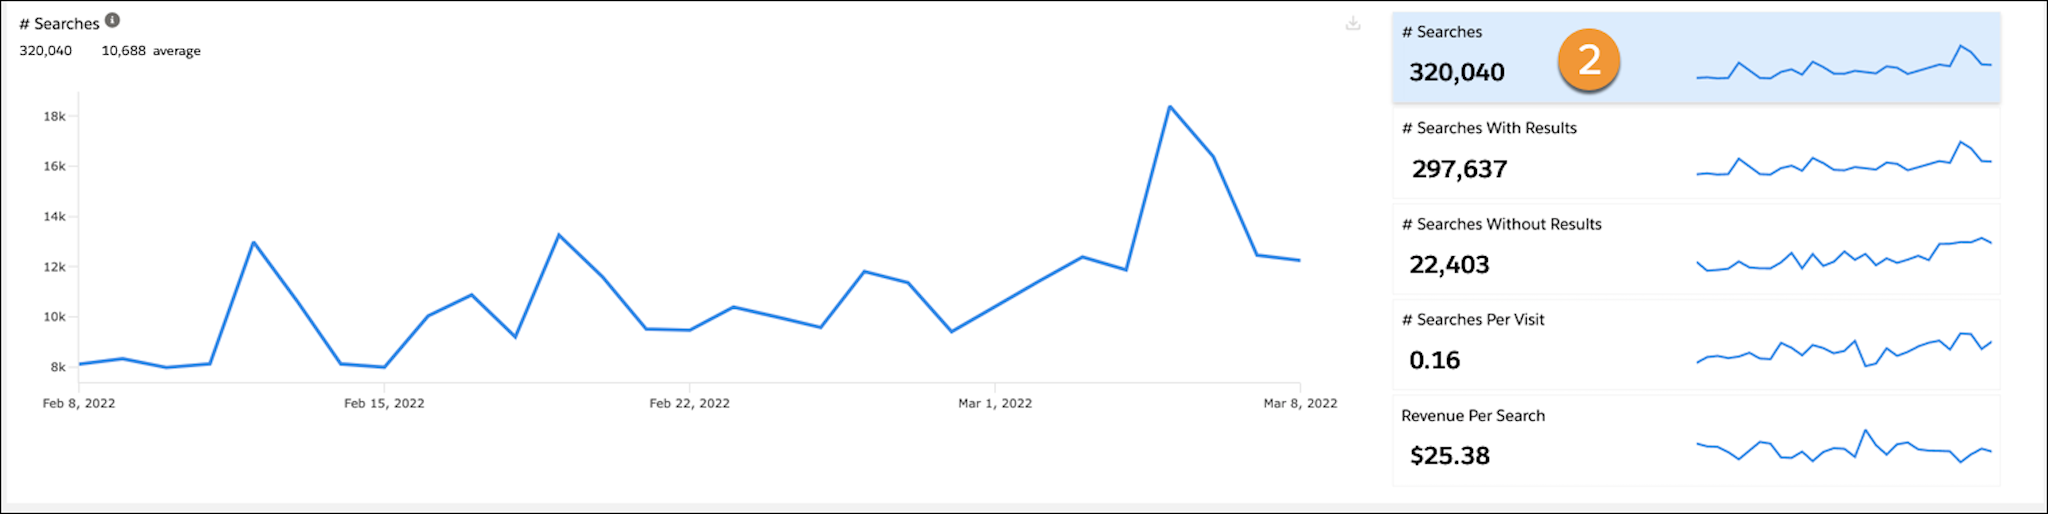
These metrics the catch your attention:
-
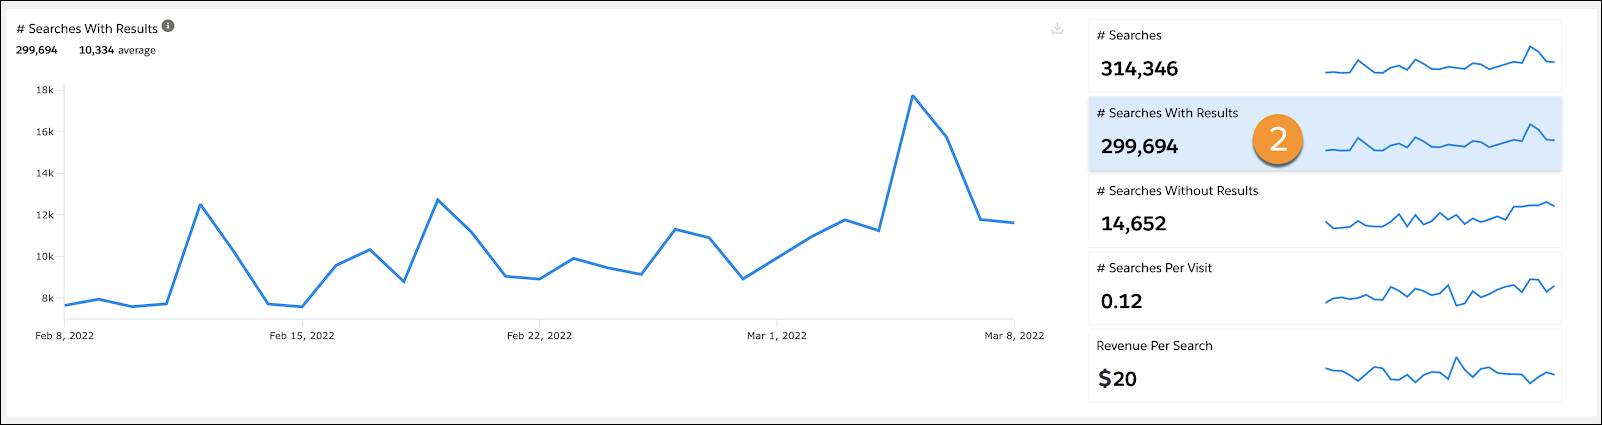
Searches: The number of searches for the month (2) exceeds the previous month's performance (1). Credit the improved customer search experience, which anticipates search trends and taps the power of Einstein search recommendations. Searches tend to spike during sales and promotional events, so fine-tune your search settings for promotion- and sale-related terms.

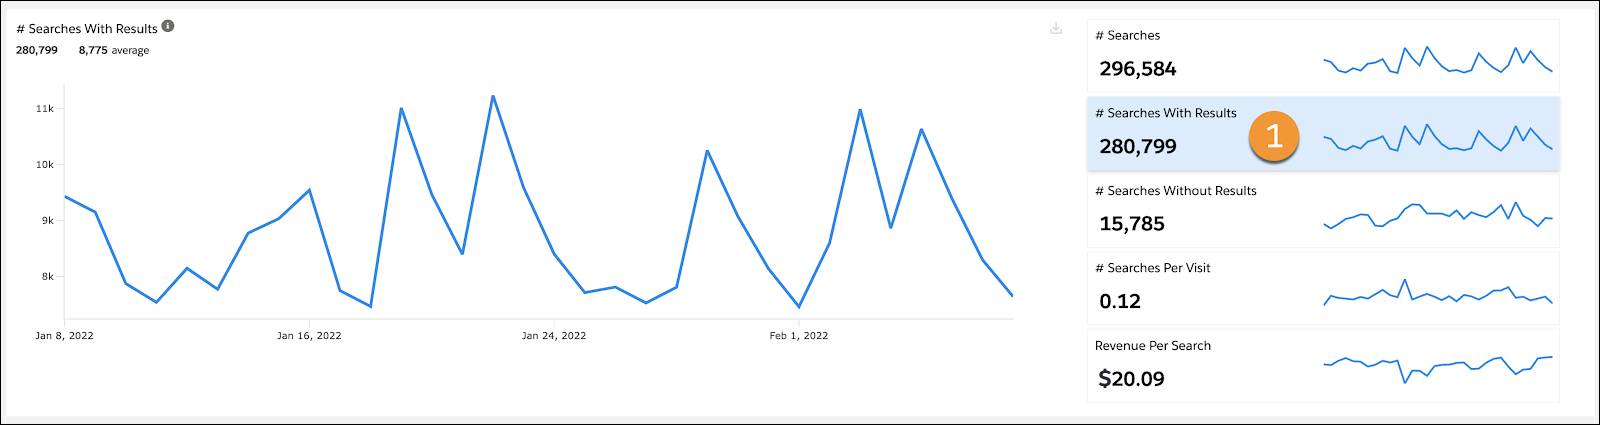
-
Searches with Results: Searches with results (2) also climb higher than before you implemented the new strategy (1). A quick calculation shows that searches with results make up 93 percent of total searches, a strong signal that shoppers experience a positive search experience.
Watch Your Phraseology
The search phrase hiking shows as a top search phrase with results (1). Comfort Hiking and Flexible Hiker show as the top search phrases without results (2), and you want these multi-word phrases to return the same results as hiking. You ask your team to add them as common phrases in the Business Manager search dictionaries.

Get Targeted Results
Searches with results peaked over the weekend, when you ran a BOGO sale on FasterSocks products. Filtering to the past week, two metrics stand out.
- The top search phrase for the week is FasterSocks, accounting for 15 percent of all searches with results (1).
- The second search phrase for the weekend is buy-one-get-one, accounting for 10 percent of all searches with results (2).

These metrics show you that your on-site search strategy responded as planned during the sale. You round out your assessment by checking the conversion rate and merchandise value attributed to both phrases on the Search Conversion dashboard.
The On-Site Search Top Search dashboard gives you the metrics you trust to evaluate your storefront search strategy: search volume, results rates, searches per visit, revenue per search, top phrases with and without results, and click-through rate. Filter these reports by site, date range, and device type, and apply what you find to your search dictionaries, searchable product attributes, and search index.
Next Steps
In this unit, you learned how to use the On-Site Search Top Search Terms dashboard to evaluate the performance and use of on-site search. Next, you examine the Search Conversion dashboard and learn how to evaluate how your search strategy converts shopper searches to orders and revenue.