Create a Data Graph
Learning Objectives
After completing this unit, you’ll be able to:
- Create a data graph.
- Explain the role of the primary data model object (DMO) in building a data graph.
- Perform key actions with data graphs, such as adding related objects.
Create a Data Stream
Before you can ingest data into Data 360, a user first needs to configure any data source that you’d like to connect. For this project, we’ve already connected a Sales Cloud and Service Cloud org to your Developer org. Since these data source connections are already established, you can now add data streams to Data 360.
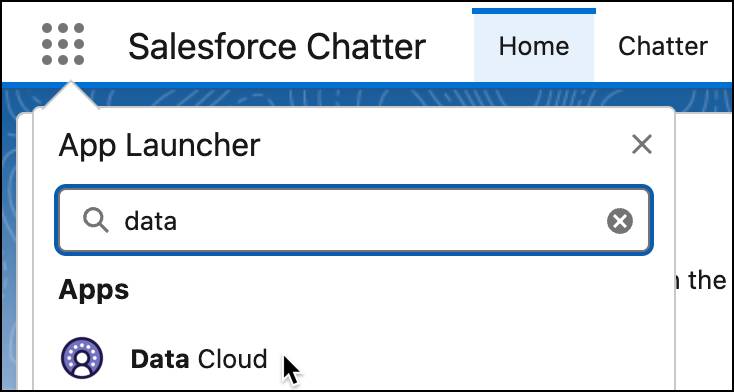
- Once you are logged into your custom playground, go to Data Cloud from the App Launcher
 and search for and select Data Cloud.
- In Data Cloud, click on the Data Streams tab and click New.
- Click Salesforce CRM under Connected Sources, and click Next.
- Note the Salesforce Org is preselected. From View Bundles, choose the Sales data bundle and click Next.
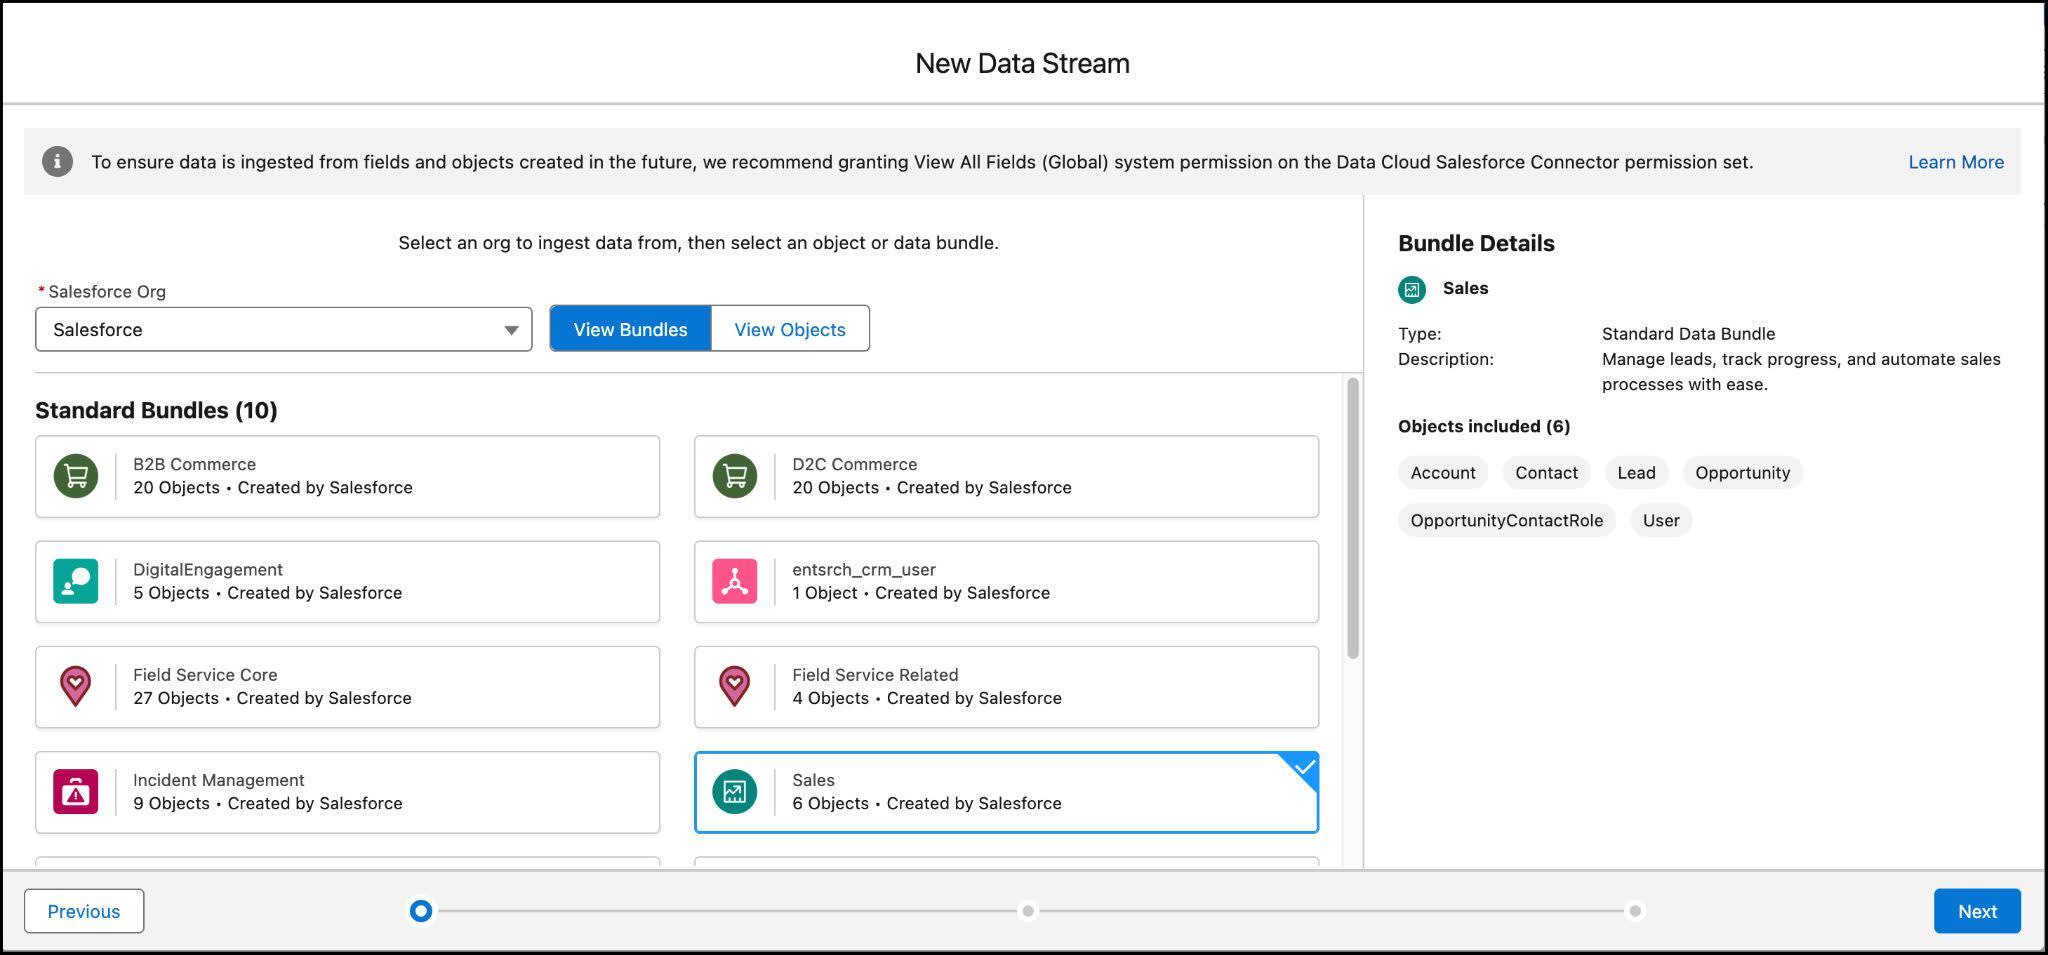
- View the associated fields and click Next.
- Notice that the default Data Space is preselected and all the fields included in the bundle are listed. Leave the selections as is, and click Deploy.

Create a Data Graph in Data 360
Before You Begin
Verify that your assigned Data Cloud permission set has access to the default data space used in this project. Otherwise, eligible Data Model Objects such as Individual may not appear as available primary DMO when you create a data graph.
Before you begin building your data graph, you must select a primary DMO. The primary DMO acts as the core object and other related DMOs are linked to it. The primary DMO belongs to the Profile category, and you can add other related DMOs that are associated with it.
- In Data Cloud, under the More menu option, select Data Graphs.
- Click New.
- Click Start from Scratch.
- On the New Data Graph screen, in the Data Graph Name section, enter
my_test_dg. The Data Graph API Name section is automatically populated to my_test_dg.
- From the Data Space dropdown, leave default as the selection.
- From the Primary Data Model Object section, click the
 and select Individual and click Next.
- Select these fields from the primary DMO to include in the data graph:
-
Birth Date
-
Created Date
-
First Name
-
Last Name
-
Birth Date
- To add related objects, click the + button next to the Individual Data Model Object. (you can also do this by using the search field) and select Contact Point Address.
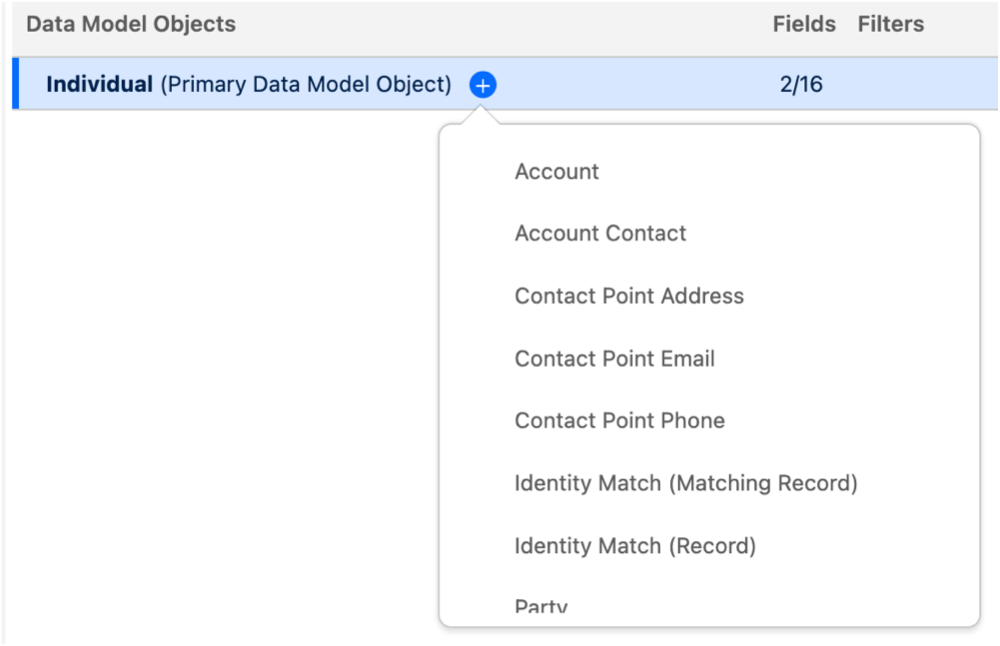
- Next to Contact Point Address, click the + button and select Account Contact.
- For Account Contact, select the following Field Label/Name:
-
Account
-
Contact Email
-
Last Activity Date
-
Account
- Click Save and Build.
- From the available refresh intervals, select Weekly. For cost savings or if frequent updates aren’t critical, consider a less frequent refresh.
- Click Save and Build.
That’s it! Your new data graph, my_test_dg, is listed in the Data Graphs page. Once the Last Run Status column displays Active, you are ready to check the challenge.
If you don’t want to build your data graph from scratch, you can create a data graph using a data kit. A data kit provides prebuilt data graphs that are easy to deploy and customize. Changes to data graphs within a data kit don’t affect the original data kit, so you can deploy and modify these graphs with minimal impact.
Data graph creation can take between 15 minutes to several hours, depending on the size and complexity of the primary DMO and related objects. You can track the status of your data graph creation on the Data Graphs tab.
Now you’ve seen how to build a data graph in Data 360. You created a graph from scratch, selected a primary data model object, and added related objects and fields. You also learned how to refresh and manage your graph so it stays up to date. With these skills, you can start modeling customer data in a way that highlights key relationships and makes it easier to explore and analyze.
Verify Your Data Graph in Data 360
Once you have completed all the above steps in your Developer org and your data graph is active (and not in Processing or Creating status under the Last Run Status column), you can check your work by selecting the Check Challenge.