Track a Referral Program
Learning Objectives
After completing this unit, you’ll be able to:
- Explain how to use dashboards to make key business decisions.
- Use predictive analytics to identify segments and maximize reach.
Track Member Participation
The Cloud Kicks Referral Program is gaining momentum with a steady stream of new customers. To measure the success of the program, Lucy monitors key metrics like referral conversion rates and revenue generated from referrals.
Referral Marketing is integrated with CRM Analytics, so you can track your programs and promotions using these performance dashboards.
- Referral Marketing Performance
- Referral Program Performance
- Promotion Performance
- Likely to Refer, part of Einstein Analytics
Let’s join Lucy as she explores each dashboard.
Analyze Marketing Performance
Lucy wants to analyze the overall program progress, including referrals, performance over time, and advocate participation.
On the Referral Marketing home page, the Referral Marketing Performance dashboard shows data on customer participation and referral conversion trends.
This dashboard has three components:
- Referrals and Referral Conversions
- Program Performance over Time
- Advocate Participation and Referral Channel Performance
The screen shows the Referrals and Referral Conversions component of the dashboard.
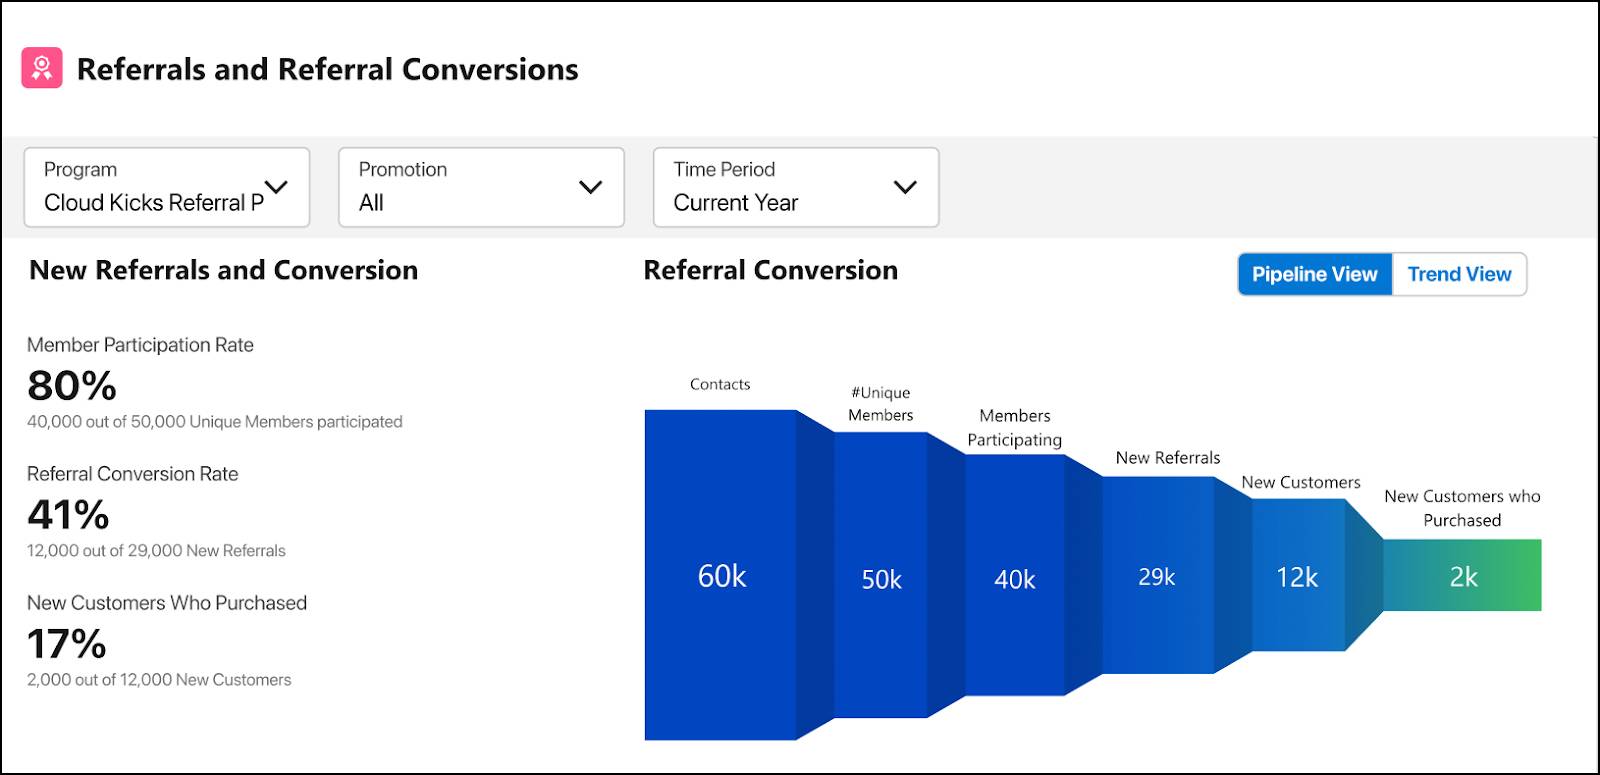
The member participation rate is 80%, which means that 40,000 out of 50,000 members have signed up for the program. Advocates made 29,000 referrals, out of which 41% have signed up. However, only 17% of the referrals have made a purchase. This low conversion rate may be due to the newness of the program.
Because promotions have associated costs, you can closely monitor the performance in the Program Performance over Time component. For example, examine the weekly or monthly trends in promotion revenue and liability. If the program runs multiple promotions, analyze the performance of each one individually.
Here’s a view of the Give $20, Get $20 promotion’s performance.
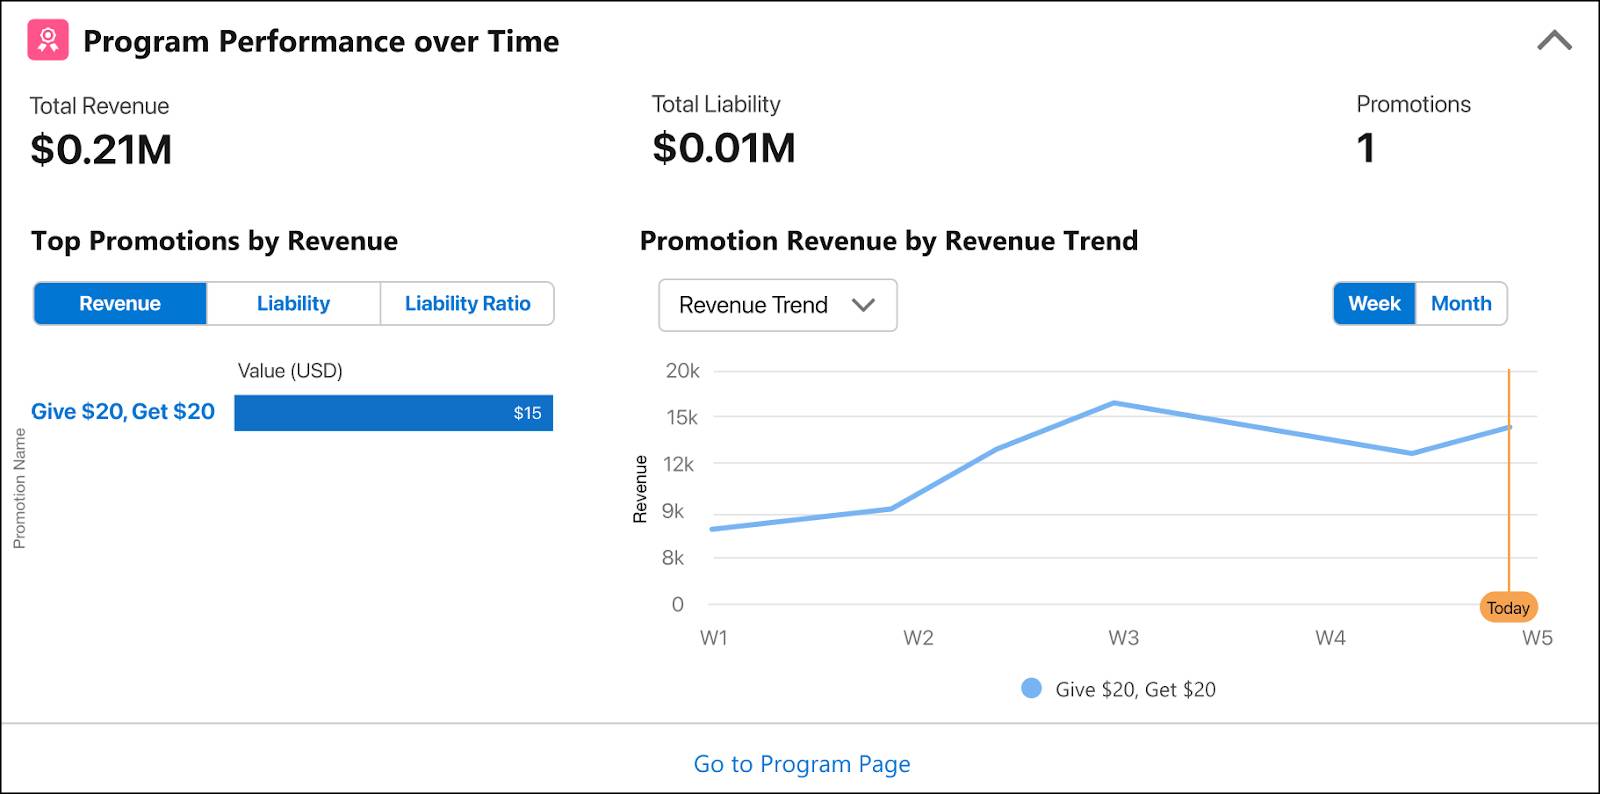
For the ongoing promotion, the ratio of liability to revenue is good. The revenue peaked in the third week, possibly due to it being the weekend before the holidays.
Next, Lucy wants to examine sign-up trends so she can allocate resources effectively and focus on the most fruitful channels. She also determines patterns in advocate participation to help understand advocate profiles.
The Advocate Participation and Referral Channel Performance component is integrated into the Referral Marketing Performance dashboard. This component has two sections: Sign Ups by Referral Channels and Advocates by Participation.
The Sign Ups by Referral Channels section displays the distribution of sign-ups.

The majority of sign-ups are through email, which means the email marketing strategy is working well.
The second section, Advocates by Participation, acts as a leaderboard, displaying the top five advocates and average referrals for each one.

View the participation either by the number of referrals or the revenue generated.
Now it’s time for Lucy to explore the Referral Program Performance and Referral Promotion Performance dashboards.
View Referral Program Performance
For a quick summary of the program performance, Lucy uses the Referral Program Performance dashboard that’s embedded in the referral program record page.

Here, you get an overview of the number of new referrals and customers with purchases.
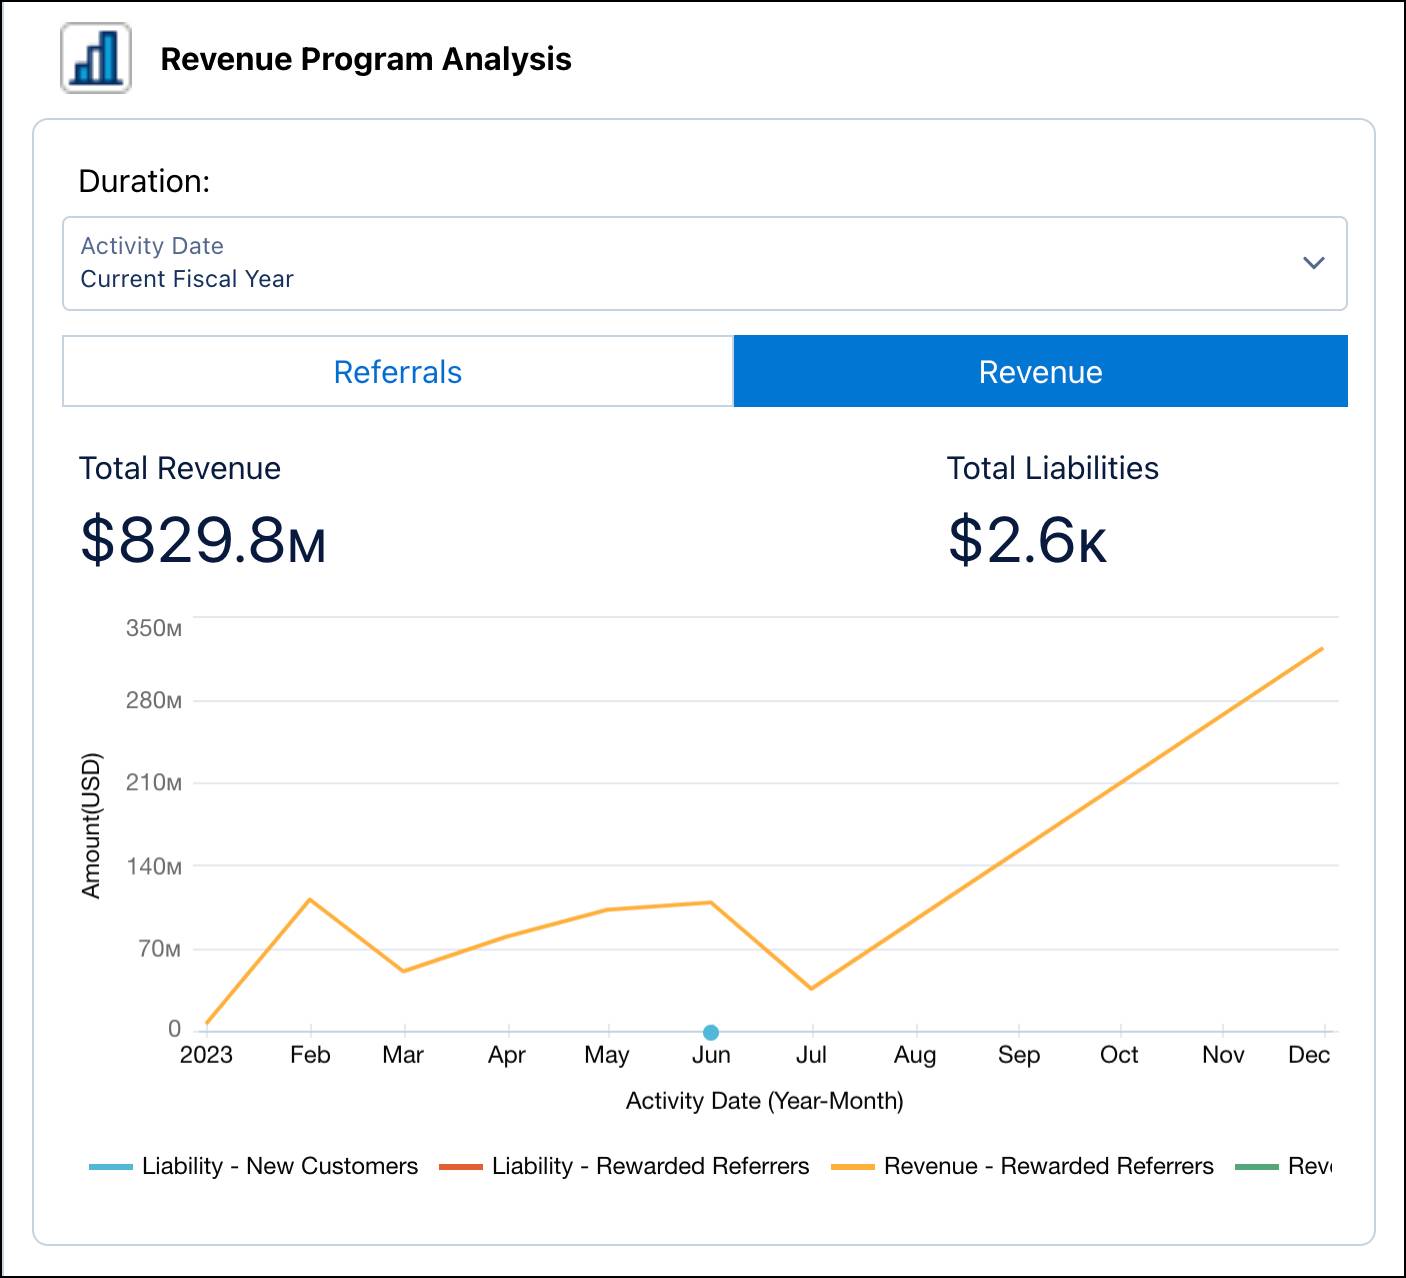
You also get a view of the trends in the program revenue.
Review Promotion Performance
Similar to the previous dashboard, Lucy uses the Referral Promotion Performance dashboard for quick analysis of specific promotions. This one’s embedded on the promotion page.
View the number of new customers who have enrolled in the promotion and the referrals they’ve generated.
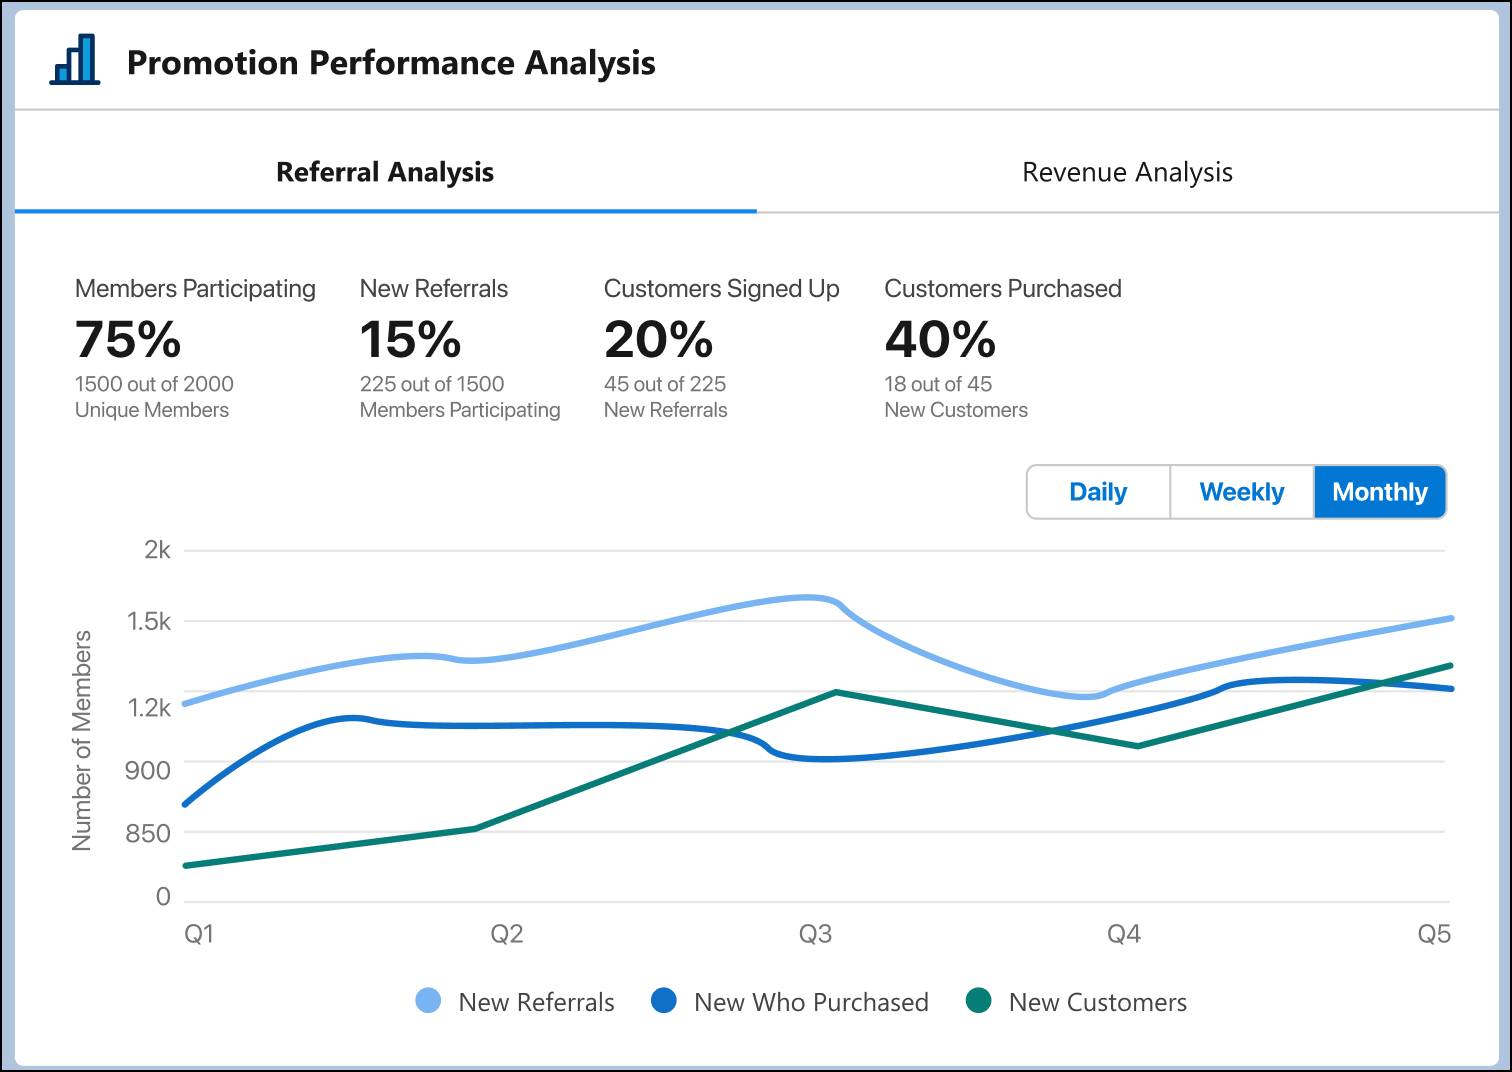
With 75% participation and an overall upward trend, the promotion is in a good place.
For the same promotion, you can also analyze the promotion revenue and liability generated by existing and new customers.

Based on all that she’s gathered so far, she summarizes that the analytics are expected. However, she wants to improve participation by extending the promotion's target audience. To identify more customer segments, she uses the Likely to Refer Analytics dashboard.
Explore Likely to Refer Analytics
Lucy wants to narrow down her target segment to those most likely to bring in referrals. She has just the tool at her disposal.
Referral Marketing Analytics integrates with Einstein Discovery and provides data analysis, predictions, and improvements in the form of a dashboard. The Likely to Refer Analytics dashboard provides a score for the likelihood of referrals.

Most advocates with a likely-to-refer score of 70 to 100 are from Texas and have been active advocates for over two years. Creating a region-specific promotion may boost engagement.
Lucy decides to create a referral promotion for the identified audience to drive the maximum impact. She adds the audience as campaign members and selects these members as the target audience in the promotion. She then crafts a personalized communication strategy, which includes targeted emails and exclusive rewards.
Conclusion
Referral Marketing lets you track your program’s performance and tailor new promotions to maximize program success. The out-of-the-box journey templates and integrations with Marketing Cloud Engagement make it so much faster and easier to launch promotions than before.
Over time, the Cloud Kicks Referral Program garners a large number of customers with high rates of retention. To celebrate the program’s success, Lucy treats her team to a three-course lunch at her favorite local Thai restaurant.
Resources
- Video: How Salesforce Referral Marketing Works
- Salesforce Help: Get Predictions About Contacts’ Likelihood of Referring
- Salesforce Help: Work with Referral Marketing Analytics