Visualize Insights with Prebuilt Dashboards
Learning Objectives
After completing this unit, you’ll be able to:
- Identify the three sectors of Event Log Object Analytics.
- Explain how to use the Request Identifier to investigate system issues.
- Describe a real-world scenario for using Analytics dashboards to solve an administrative challenge.
Before You Start
Before you start this badge, consider completing this recommended content.
From Raw Data to Actionable Intelligence
Event Log Objects (ELO) are standard Salesforce objects that store critical system activity data. Unlike Event Log Files, which are delivered in a few hours or once-daily batches, ELO data becomes available within an hour of an event occurring. This framework allows you to analyze security, performance, and user behavior directly within Salesforce by querying SOQL and Salesforce Platform APIs.
While querying objects is great for precision troubleshooting, the Event Log Objects Analytics dashboards provide a unified lens for your entire organization. These dashboards transform data logs into clear visualizations, moving you from reactive fixes to proactive system management.
These dashboards are organized into three categories: threats and access, performance and health, and user activities and journeys.
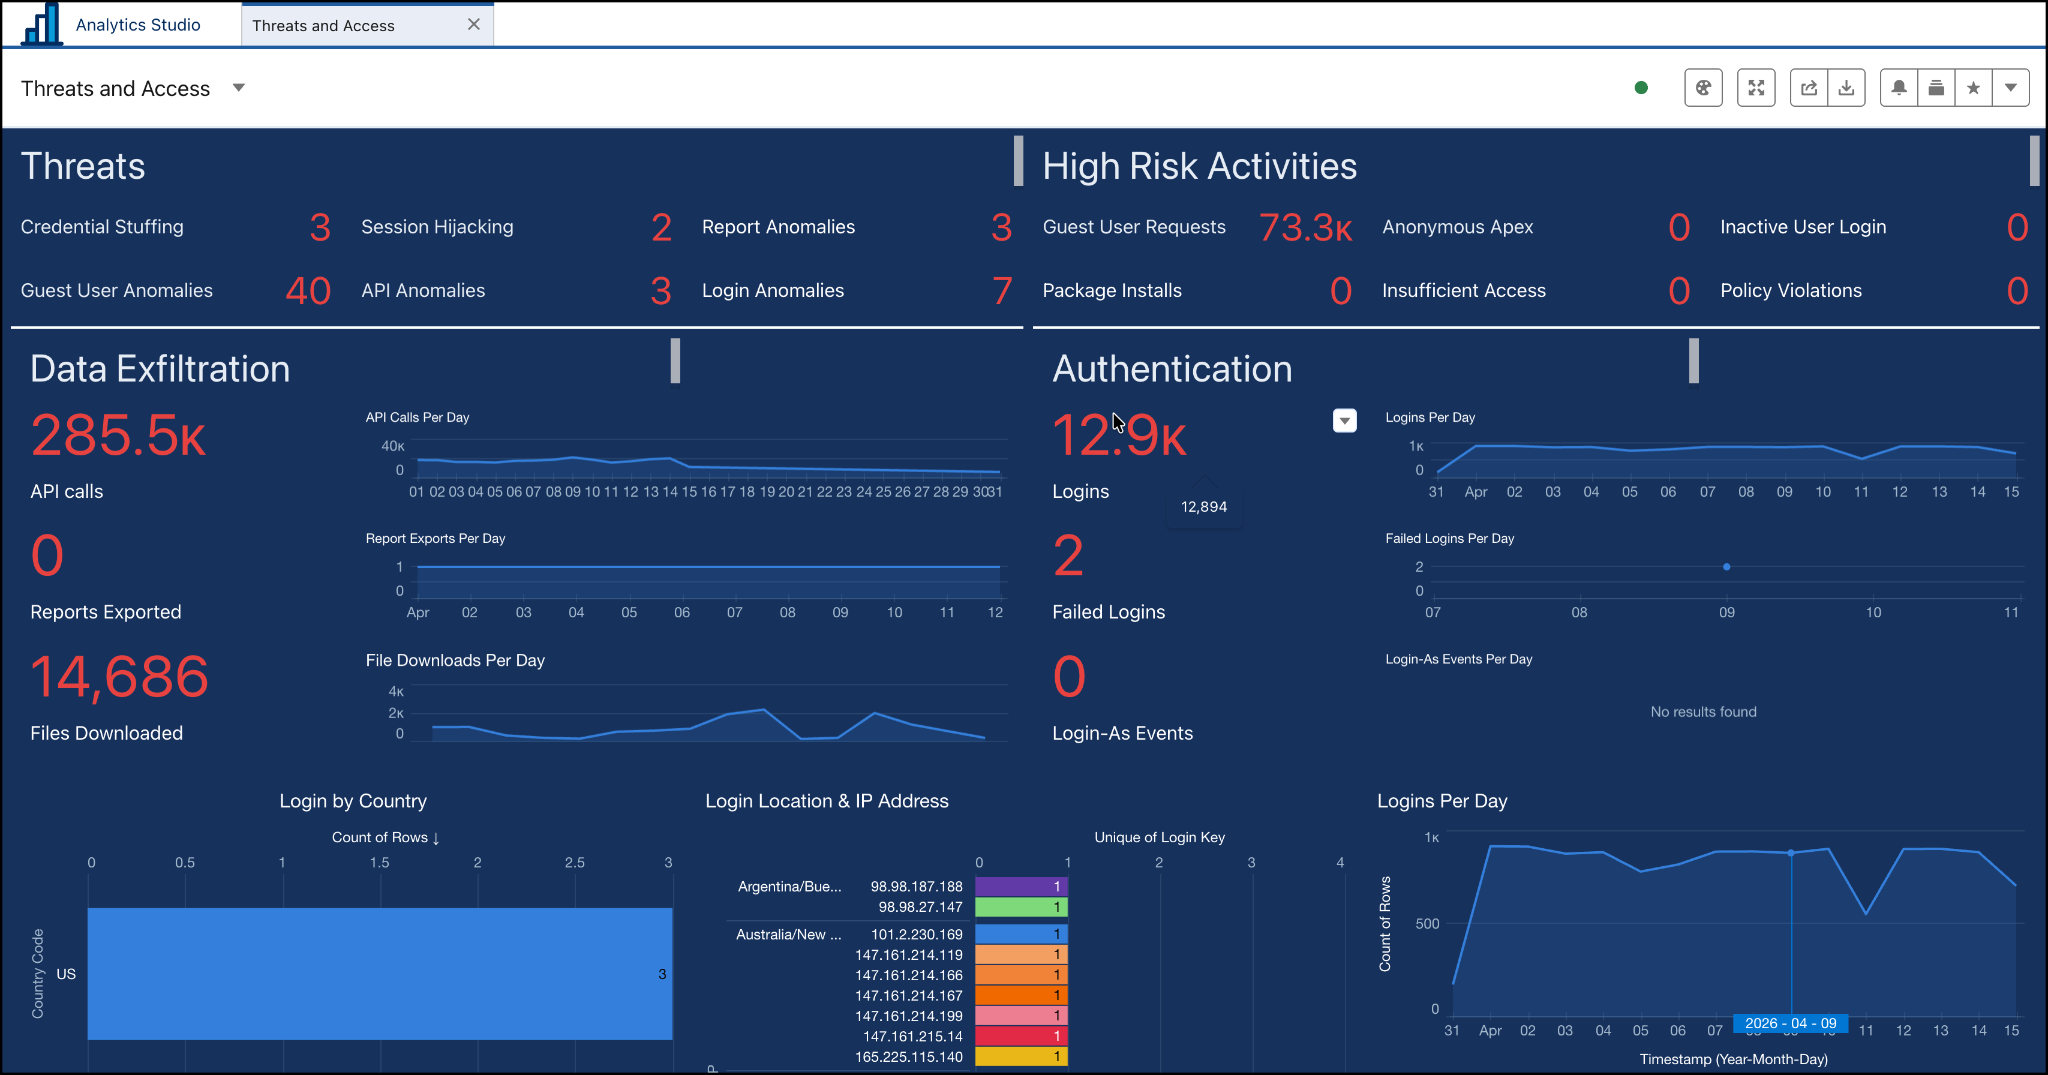
Threats and Access Dashboard
This is your primary tool for forensic investigations. Use this dashboard for:
-
Forensic investigations: Evaluate suspected security events by filtering the dashboard by a specific user or timeframe to determine exactly which data was accessed and when.
-
Targeted threat detection: Identify sophisticated identity attacks, including session hijacking and credential stuffing.
-
Data exfiltration: Track bulk API calls or unusually large report exports visually as they happen, allowing for immediate response to potential data breaches.
Performance and Health Dashboard
This tool helps you find and fix bottlenecks before your users even notice them. Use this dashboard to monitor:
-
Lightning performance: Monitor Effective Page Time (EPT) to identify which pages are loading slowly and may need simplified layouts.
-
Apex and API health: Pinpoint inefficient Apex code or integrations that are hitting governance limits or causing unexpected errors.
-
Consolidated error tracking: View all recent trends and system errors in one place to maintain peak stability.
User Activity and Journeys Dashboard
This tool tracks how users engage with different features. Use this dashboard to:
-
Track user behavior: See exactly how users navigate your application and which features they interact with most.
-
Identify gaps: Find low-adopter groups or abandoned features.
-
Conduct data-driven training: Use these insights to refine your internal training programs or justify roadmap changes for future enhancements.
Advanced Troubleshooting: The Request Identifier
Sometimes a dashboard flags an issue that requires a closer inspection. This is where the Request Identifier comes in. Every transaction in Event Monitoring is assigned a unique Request ID.
If you see a slow API call on your dashboard, you can search for that specific Request ID using SOQL to connect the dots. This allows you to see the entire unit of work, including the corresponding Apex logs and database activity, to find the root cause of the problem.
Use Case: Performing a Security Scope Assessment
As an admin, you receive an alert that a high-privilege user account might have been compromised. To protect the company, you need to perform an immediate scope assessment to see if any sensitive data was accessed or moved.
You open the Analytics Studio app and go to the Threats and Access dashboard. Then you use the dashboard’s built-in user and timestamp filters to search for the account in question and narrow the dashboard view to the exact hour the suspicious activity began.
The Logical Next Steps
-
Assess the damage: The dashboard visually displays every report the user exported and every bulk API call they made during the window of suspicious activity.
-
Identify compromised data: You can now see exactly which datasets were accessed, allowing you to tell your legal and security teams precisely what is at risk.
-
Take action: Based on these visual insights, you can immediately lock the account and rotate credentials, confident that you understand the full scope of the incident.
By using these prebuilt dashboards, you move beyond just storing data to actively improving your organization’s security, performance, and adoption. You’re now equipped to turn near real-time insights into administrative excellence!