Create a Dashboard
Dashboards show you the most important information you want, in a way that makes the most sense to you.
In this step you'll add the report you just created to a new dashboard.
- Click the Dashboards tab.
- Click New Dashboard.
- Name your dashboard
All Opportunities. Leave all other fields as is and click Create. - Click +Widget. Select Chart or Table.
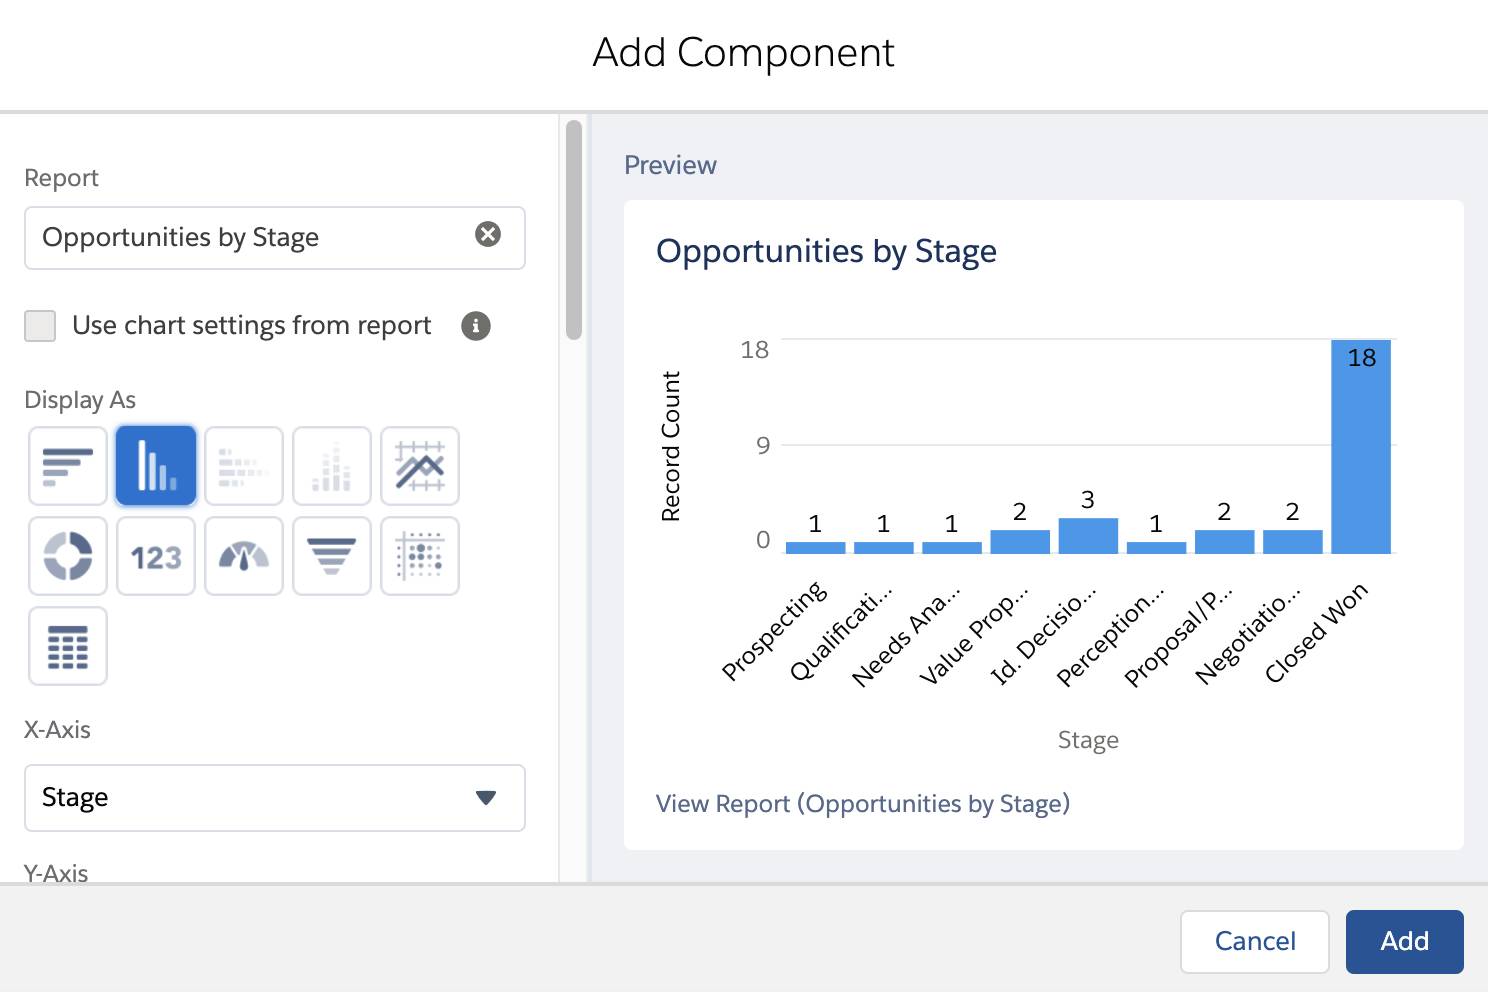
- For Report, select Opportunities by Stage. Click Select.
Note: Don't see that report? Make sure you've updated your report by using the Add group search and grouped by Stage. Go back to the previous step in this project. - For Display As, select Vertical Bar Chart and click Add.
- Click Save.
- Click Done.
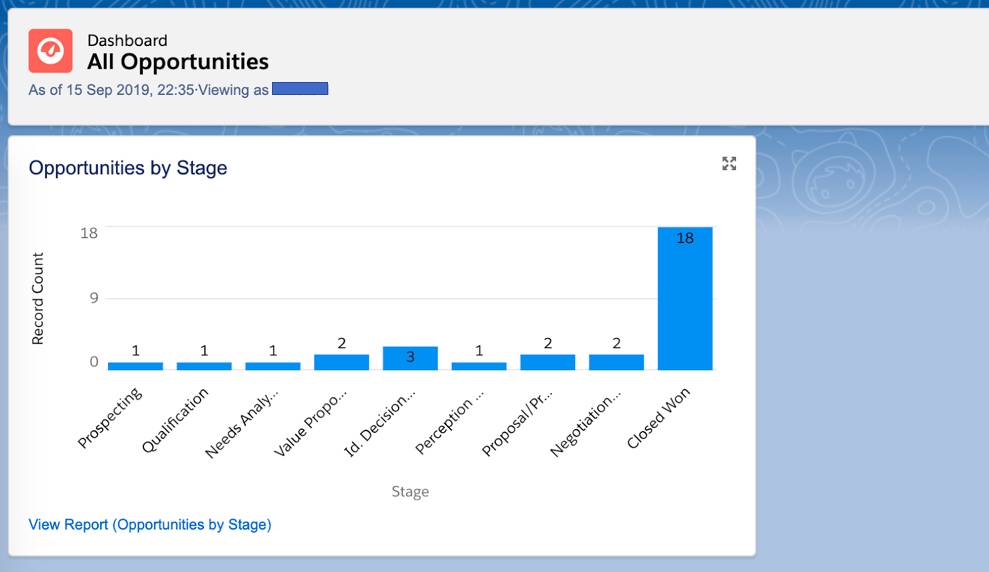
- The dashboard executes and displays the count of Opportunity records that are in each stage as a vertical bar chart.
Summary
As you can see, it's really easy to create reports and dashboards. If you have the Salesforce mobile app installed, you can even see reports and dashboards right from your mobile device! To learn more, check out the Trailhead project on Lightning Experience Reports & Dashboards.