Analyze and Act on Your Supplier Data
Learning Objectives
After completing this unit, you’ll be able to:
- Configure a custom report by selecting dimensions, measures, and filters to answer a specific business question.
- Analyze custom report data to identify patterns and draw conclusions that support business decisions.
- Explain how to export report data and manage existing reports to keep your report library current.
From Question to Custom Report
The quarterly review is 2 days away. Sam answered two of the procurement director's questions using predefined reports. These reports provided the total supplier and contact record counts from Number of Records by Business Entity. They also identified a significant gap in valid reports from the Number of Valid Records by Business Entity traced to the Procurement source system. But the third question is still open—how are the resort’s suppliers distributed across US states? This needs a custom report.
This unit covers how to configure a custom report, read what the data means, and export findings for deeper analysis—skills that turn raw data into real answers.
What Goes Into a Custom Report
Review what each component of a custom report means.

Configure Your First Custom Report
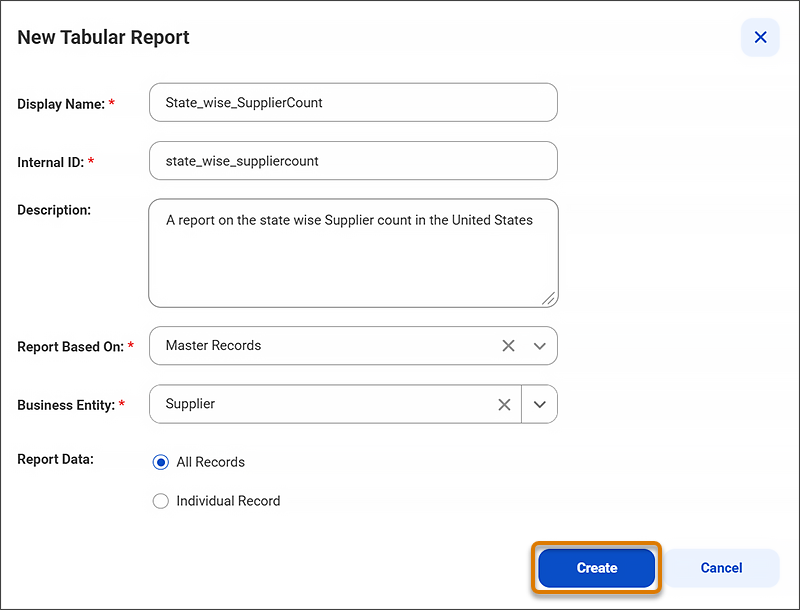
To set up the report, select New | Reports and Dashboards | Tabular Report | Create. Then enter these details:
-
Display Name: State_wise_SupplierCount
-
Report Based On: Master Records
-
Business Entity: Supplier
-
Report Data: All Records
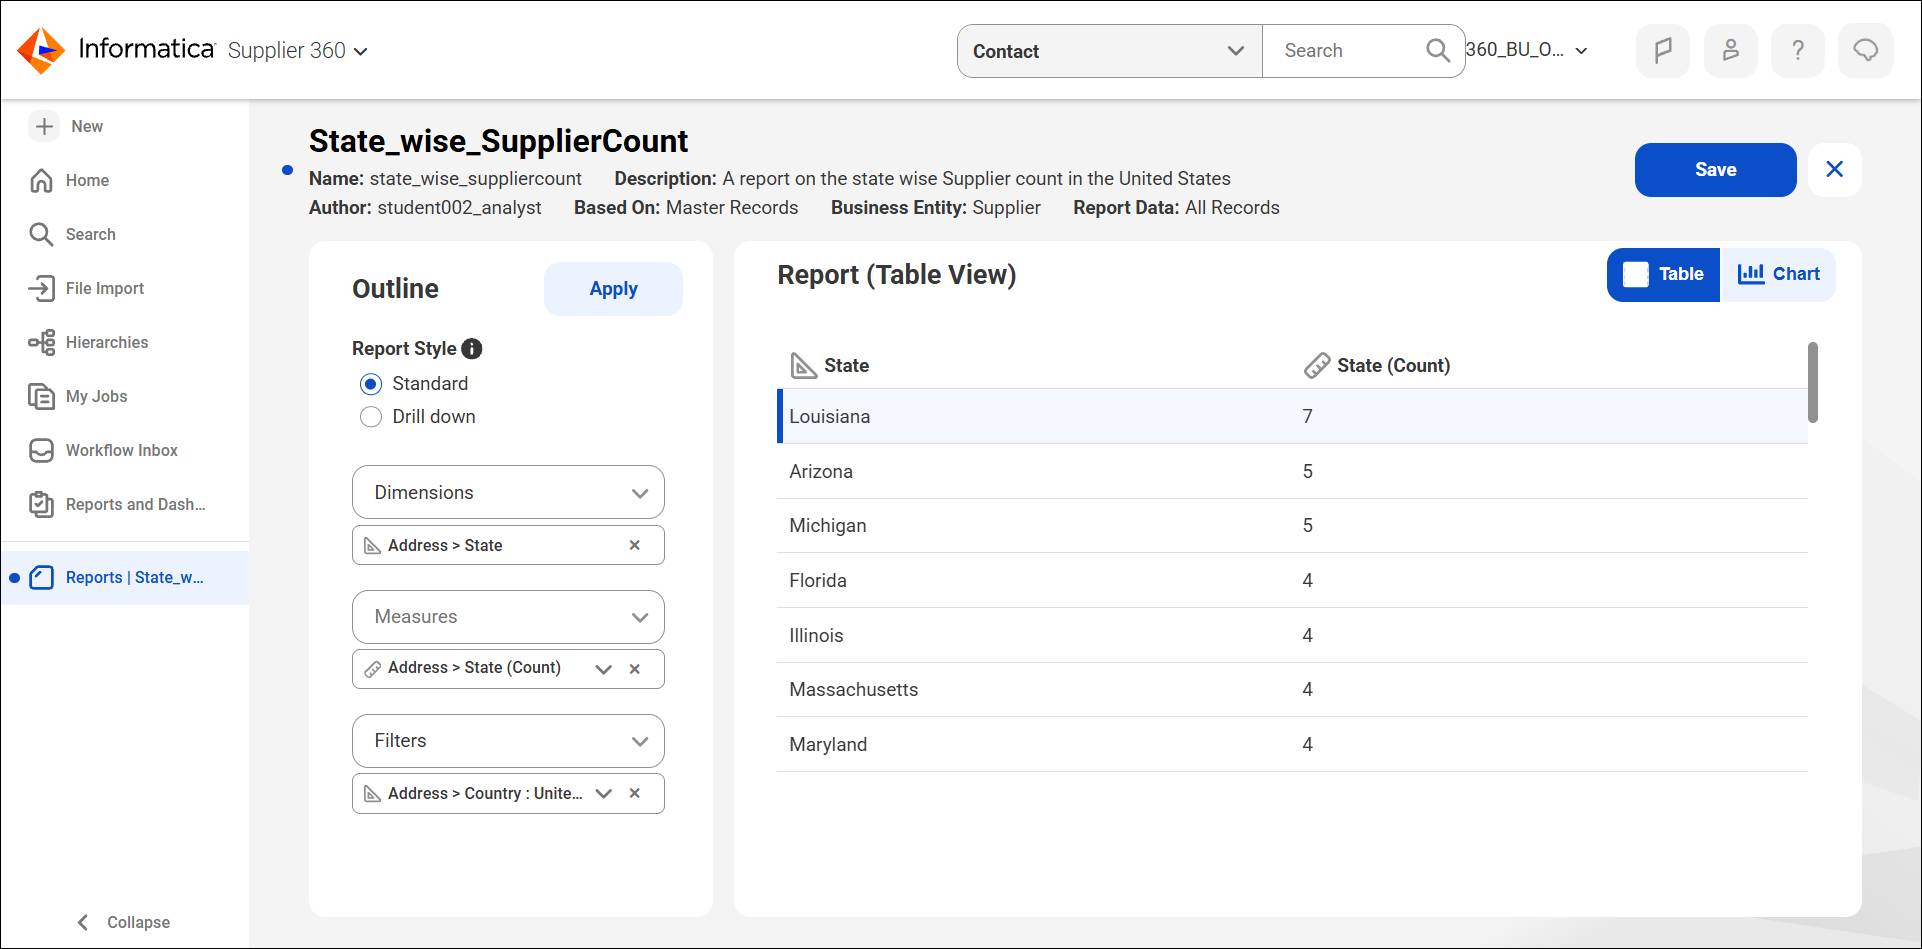
In the report builder, configure the following.
-
Report Style: Standard
-
Dimensions: State—the field to group suppliers by
-
Measures: State(Count)—the number of supplier records per state
-
Filter: Country—Text, Equals, United States—narrows results to US suppliers only
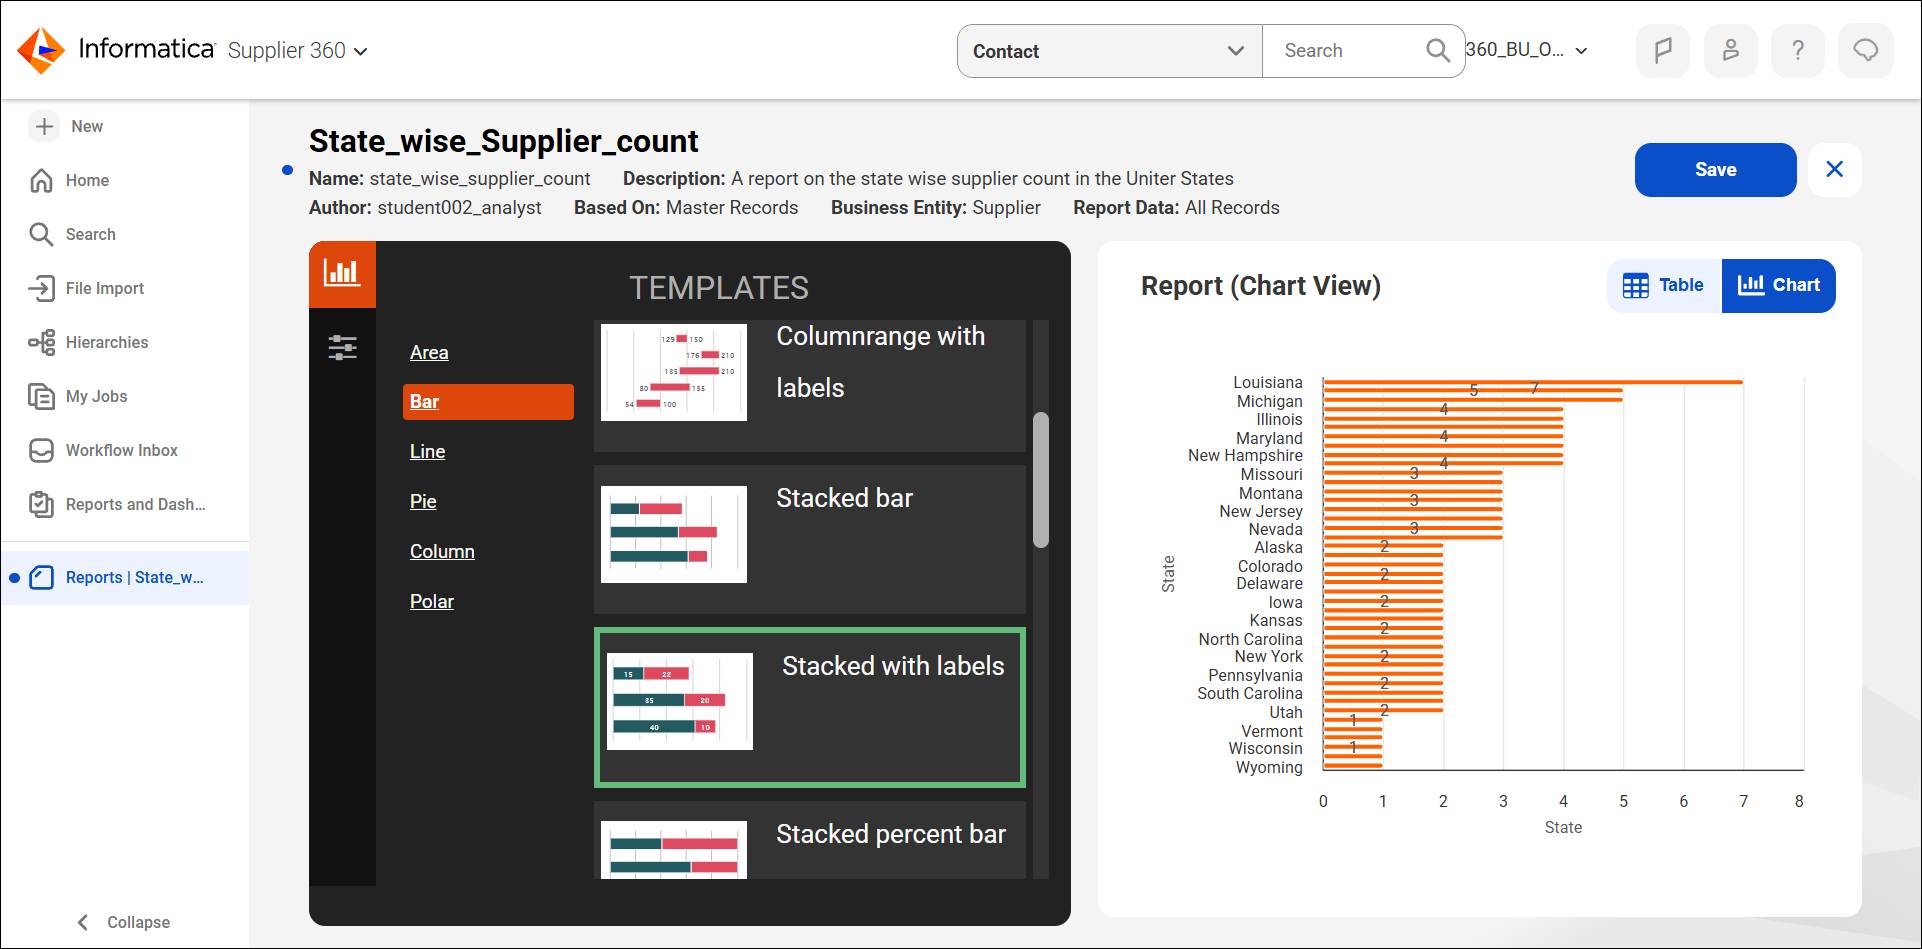
Sam applies the changes, reviews the chart preview, adds a bar chart that includes multiple state values side-by-side, and then saves the report. The report is now available on the Reports page.
Sam selects Apply. The report table loads.
Read the Distribution
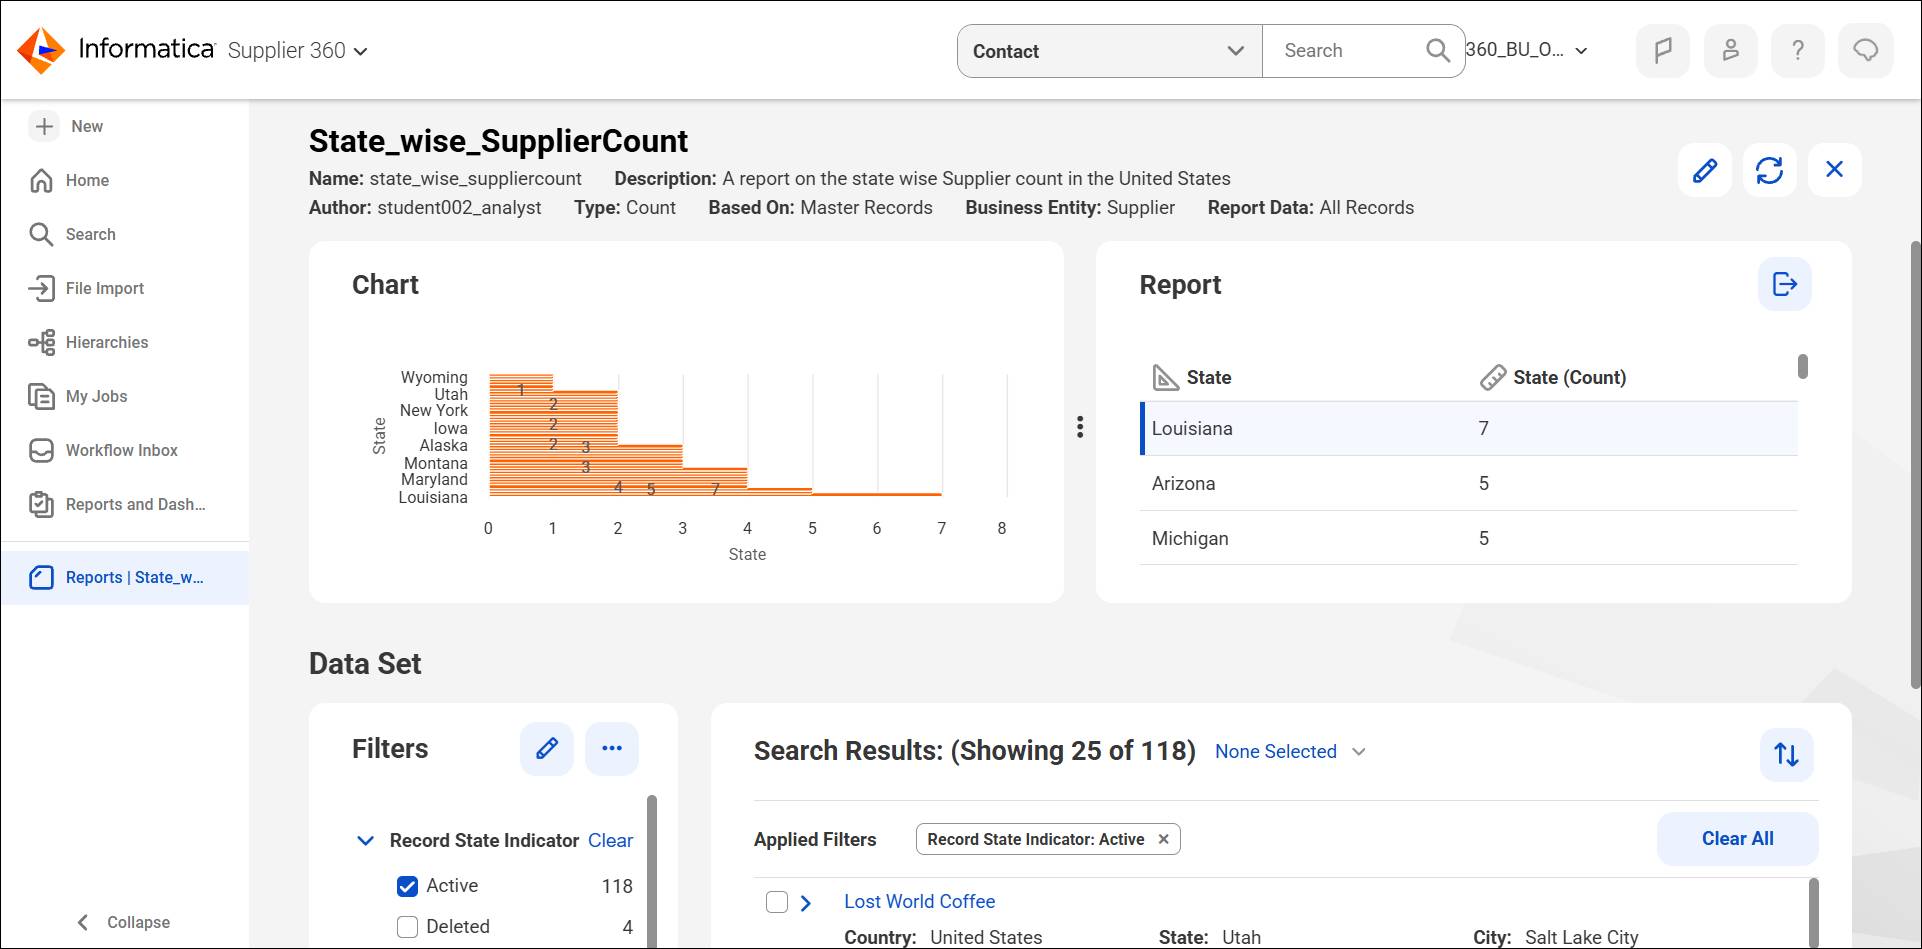
The bar chart loads instantly. Sam reads the results.
-
Louisiana: Seven suppliers
-
Arizona and Michigan: Five suppliers
-
Florida, Illinois, and others: Four suppliers each
Sam now knows how many suppliers Coral Cloud Resorts works across these regions. This geographic concentration is the exact type of information that the procurement director wants to know about because any supply chain disruptions in those regions might affect Coral Cloud Resorts.
Refine Your Report With Filters
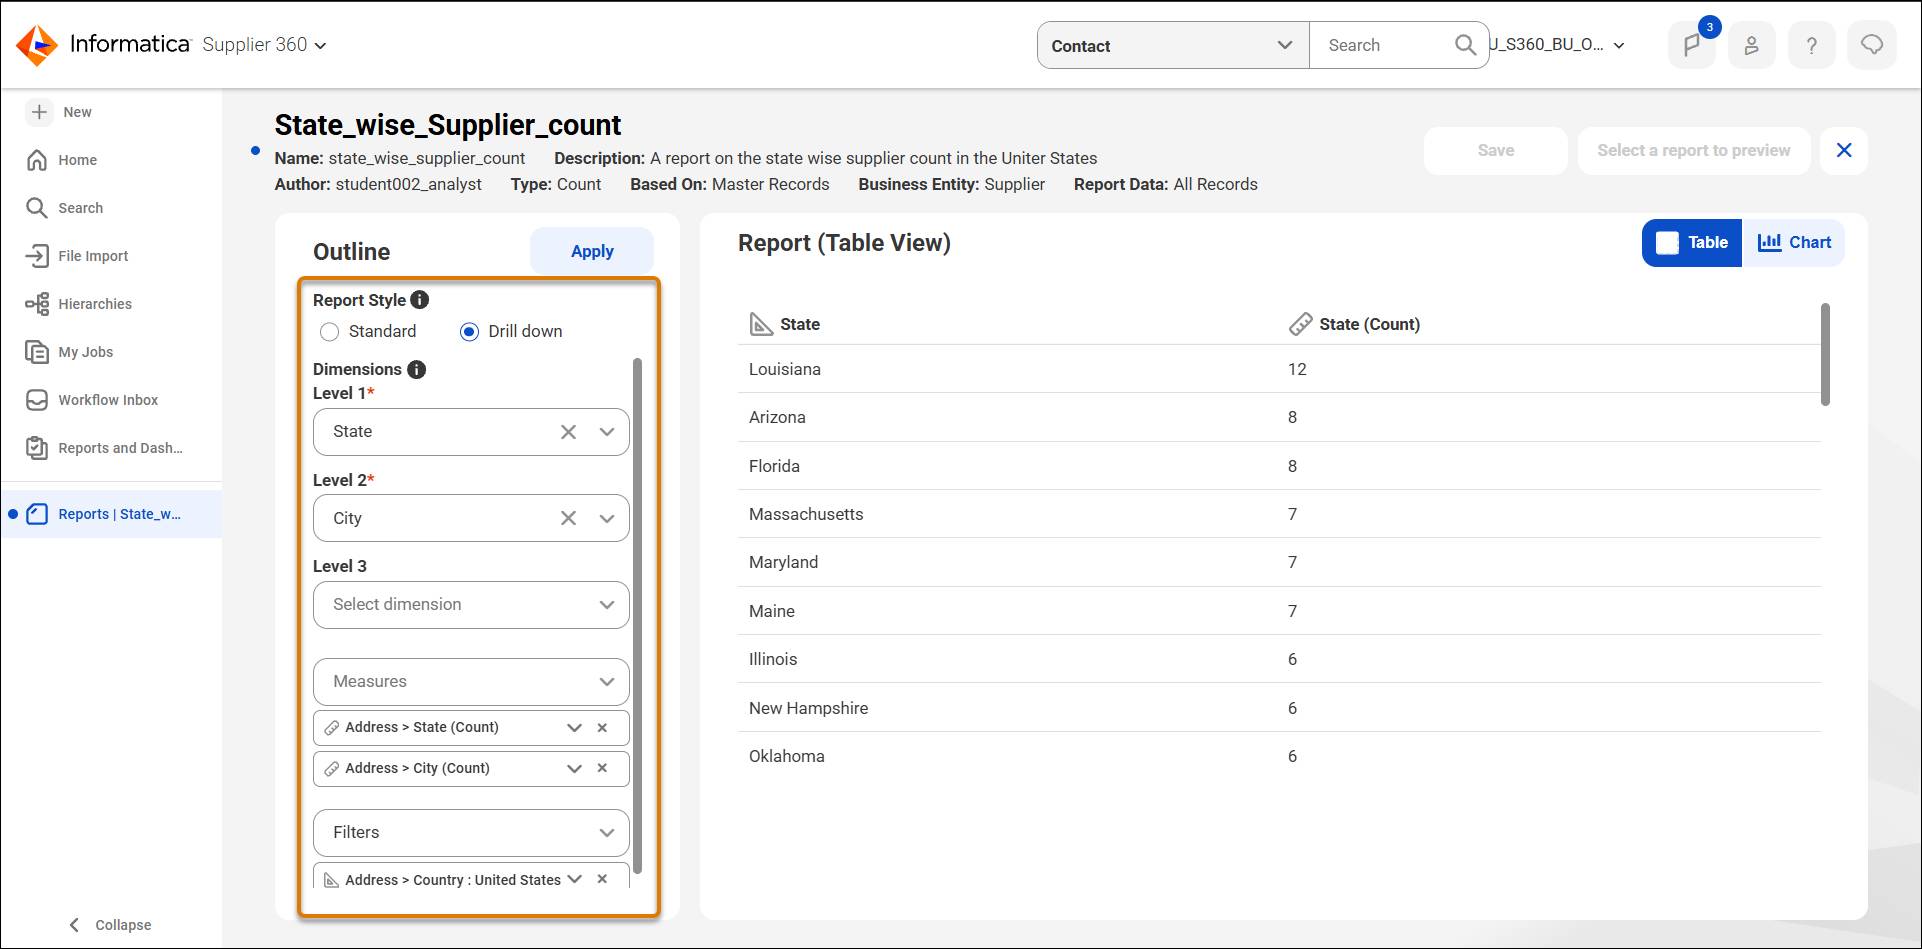
The procurement director wants to understand the supplier concentration in Louisiana in detail, such as which cities have the most suppliers. Sam opens the Suppliers by US State report, and starts to edit the report. Sam upgrades the standard report to a drill-down report by adding City as a second dimension, with State still as the first. This lets Sam select from state level to city level in the same report.
Supplier 360 SaaS supports the following filter operators by field type.
Field Type |
Available Operators |
|---|---|
Text |
Equals, In, Is Blank |
Date |
Equals, Is Blank |
Range (numeric) |
Equals, Range, Is Blank |
Boolean |
Equals, Is Blank |
Picklist |
In, Is Blank |
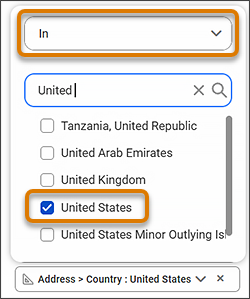
Sam uses In for the Country Picklist filter. Sam applies the changes and saves the report.
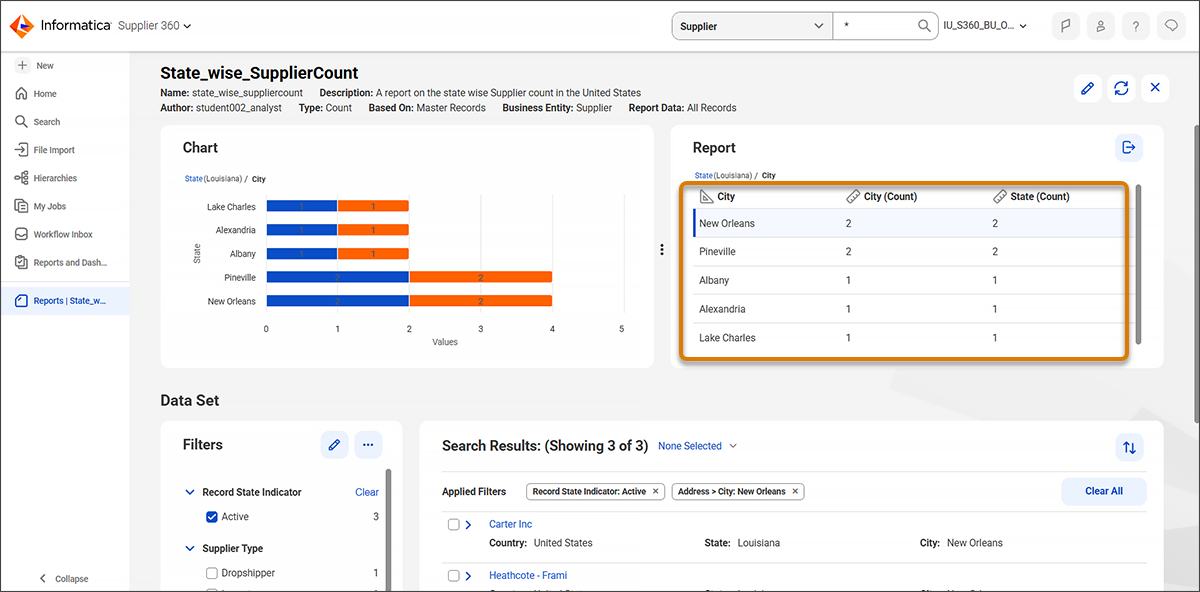
The updated report now includes supplier counts by state, and Sam can drill down to the city. Sam now has a drill-down report ready to add to a dashboard widget, and is ready to answer the procurement director’s questions.
The 500-Value Signal
As Sam adds more dimensions to a follow-up drill-down report, a note appears—the report can return more than 500 unique field values, but it only displays the first 500.
This is a system signal, not an error. If your dimension has more than 500 unique values, consider whether you need to re-segment your data. For example, you might group by region instead of individual state, or ask your administrator to add a summarization field. For Sam's US state report, 50 states won’t come close to 500 values. However, if you were reporting by city across all countries, the limit could apply.
Export Data for In-Depth Analysis
Sam wants to share the Suppliers by US State data with a colleague who’s responsible for presenting the regional procurement analysis in a separate tool. Sam exports the report to CSV.
On the Reports page, Sam opens the Suppliers by US State report and selects Export Report  . Supplier 360 SaaS downloads a CSV file.
-
State: The dimension value
-
Record Count: The measure value
-
MDM ID: The master record identifier for each supplier
-
RuleSet ID, Rule ID, RuleSet Version: The metadata fields that include which match rules were applied to each record
The MDM ID field is especially useful for joining the export to other datasets. The RuleSet and Rule ID fields help trace how each master record was produced. This is a useful context when sharing data with colleagues who weren't part of the import.
Edit and Delete Reports
With the quarterly review prepared, Sam also tidies up. Last quarter's merge review report is no longer needed.
To edit a report:
- Open the report in the Reports page.
- Select Edit.
- Update the dimensions, measures, or chart template.
- Select Apply.
- Select Save.
To delete a report:
- Open the report in the Reports page.
- Select Actions | Delete.
- Select confirm. The report is removed.
Sam filters the export by the City source system and downloads the file. The procurement director now has a row-level view of every import record—which city has the most suppliers, which city has the least suppliers, and which state has the most suppliers.
With the custom report ready and the CSV in the procurement director's hands, Sam has answered all three questions from the director. In the next unit, you’ll bring these findings together into a single view.
Resources
- Informatica Documentation: Supplier 360: Manage Reports (login required)