Monitor Your Architecture with Amazon CloudWatch
Learning Objectives
After completing this unit, you’ll be able to:
- Explain how Amazon CloudWatch works.
- Explain what types of data Amazon CloudWatch can monitor.
- Define the basic terminology and concepts of Amazon CloudWatch.
Think of Amazon CloudWatch as a central repository for metrics. When data points, or metrics, are monitored over a specific amount of time, they become statistics, and you can use these statistics to analyze and manage your AWS resources.
So far, you learned that having visibility into your AWS resources is beneficial, but how does CloudWatch collect these metrics? How can you use CloudWatch to analyze statistics? What types of data does CloudWatch collect and what features does CloudWatch offer to make this data actionable and accessible? Learn the answers to these questions in this unit.
How CloudWatch Works

The great thing about CloudWatch is that all you need to get started is an AWS account. It is a managed service, which enables you to focus on monitoring, without managing any underlying infrastructure.
Your cat photo app is built with various AWS services working together as building blocks. It would be difficult to monitor all of these different services independently, so CloudWatch acts as one centralized place where metrics are gathered and analyzed. You already learned how EC2 instances post CPU utilization as a metric to CloudWatch. Different AWS resources post different metrics that you can monitor. You can view a list of services that send metrics to CloudWatch in the resources section of this unit.
Many AWS services send metrics automatically for free to CloudWatch at a rate of one data point per metric per 5-minute interval, without you needing to do anything to turn on that data collection. This by itself gives you visibility into your systems without you needing to spend any extra money to do so. This is known as basic monitoring. For many applications, basic monitoring does the job.
For applications running on EC2 instances, you can get more granularity by posting metrics every minute instead of every 5 minutes using a feature like detailed monitoring. Detailed monitoring has an extra fee associated. You can read about pricing on the CloudWatch Pricing Page linked in the resources section of this unit.
Break Down Metrics
Each metric in CloudWatch has a timestamp and is organized into containers called namespaces. Metrics in different namespaces are isolated from each other—you can think of them as belonging to different categories.
AWS services that send data to CloudWatch attach dimensions to each metric. A dimension is a name/value pair that is part of the metric’s identity. You can use dimensions to filter the results that CloudWatch returns. For example, you can get statistics for a specific EC2 instance by specifying the InstanceId dimension when you search.

Set Up Custom Metrics
Let’s say for your cat photo application you wanted to record the number of page views your website gets. How would you record this metric to CloudWatch? It’s an application-level metric, meaning that it’s not something the EC2 instance would post to CloudWatch by default. This is where custom metrics come in. Custom metrics allows you to publish your own metrics to CloudWatch.
If you want to gain more granular visibility, you can use high-resolution custom metrics, which enable you to collect custom metrics down to a 1-second resolution. This means you can send one data point per second per custom metric.
Other examples of custom metrics are:
- Web page load times
- Request error rates
- Number of processes or threads on your instance
- Amount of work performed by your application
Understand the CloudWatch Dashboards
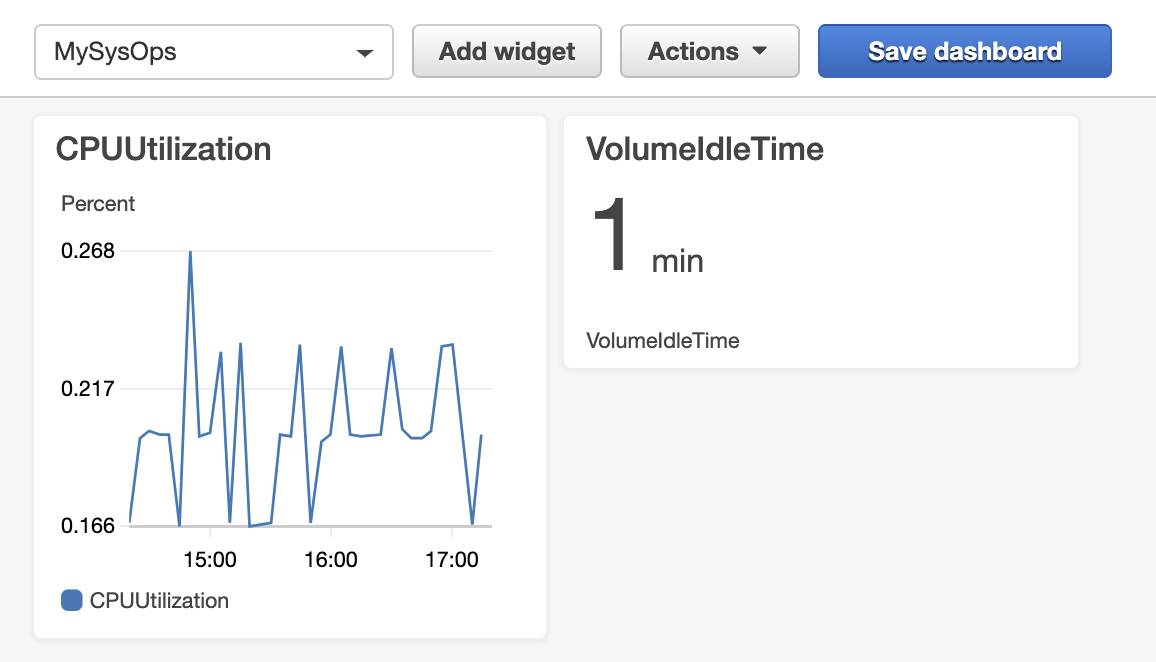
Once you’ve provisioned your AWS resources and they are sending metrics to CloudWatch, you can then visualize and review that data using the CloudWatch console with dashboards. Dashboards are customizable home pages that you use for data visualization for one or more metrics through the use of widgets, such as a graph or text.
You can build many custom dashboards, each one focusing on a distinct view of your environment. You can even pull data from different Regions into a single dashboard in order to create a global view of your architecture.

CloudWatch aggregates statistics according to the period of time that you specify when creating your graph or requesting your metrics. You can also choose whether your metric widgets display live data. Live data is data published within the last minute that has not been fully aggregated.
You are not bound to using CloudWatch exclusively for all your visualization needs. You can use external or custom tools to ingest and analyze CloudWatch metrics using the GetMetricData API.
As far as security goes, you can control who has access to view or manage your CloudWatch dashboards through AWS Identity and Access Management (IAM) policies that get associated with IAM users, IAM groups, or IAM roles.
Get to Know CloudWatch Logs
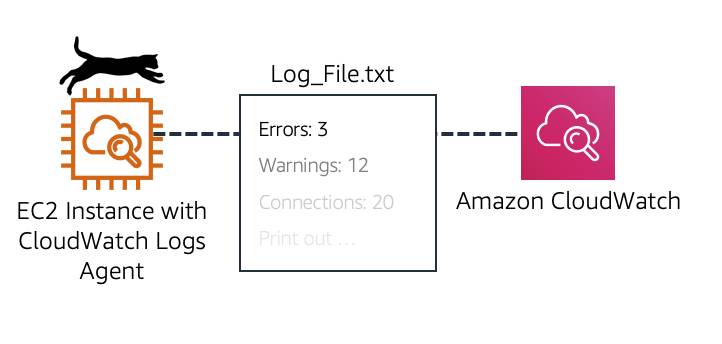
CloudWatch can also be the centralized place for logs to be stored and analyzed, using CloudWatch Logs. CloudWatch Logs can monitor, store, and access your log files from applications running on Amazon EC2 instances, AWS Lambda functions, and other sources.
CloudWatch Logs allows you to query and filter your log data. For example, let’s say you’re looking into an application logic error for your cat photo sharing application, and you know that when this error occurs it will log the stack trace. Since you know it logs the error, you query your logs in CloudWatch Logs to find the stack trace. You also set up metric filters on logs, which turn log data into numerical CloudWatch metrics that you graph and use on your dashboards.
Some services are set up to send log data to CloudWatch Logs with minimal effort, like AWS Lambda. With AWS Lambda, all you need to do is give the Lambda function the correct IAM permissions to post logs to CloudWatch Logs. Other services require more configuration. For example, if you want to send your application logs from an EC2 instance into CloudWatch Logs, you need to first install and configure the CloudWatch Logs agent on the EC2 instance.

The CloudWatch Logs agent enables Amazon EC2 instances to automatically send log data to CloudWatch Logs. The agent includes the following components.
- A plug-in to the AWS Command Line Interface (CLI) that pushes log data to CloudWatch Logs.
- A script that initiates the process to push data to CloudWatch Logs.
- A cron job that ensures the daemon is always running.
After the agent is installed and configured, you can then view your application logs in CloudWatch Logs.
Learn the CloudWatch Logs Terminology
Log data sent to CloudWatch Logs can come from different sources, so it’s important you understand how they’re organized and the terminology used to describe your logs.
Log event: A log event is a record of activity recorded by the application or resource being monitored, and it has a timestamp and an event message.
Log stream: Log events are then grouped into log streams, which are sequences of log events that all belong to the same resource being monitored. For example, logs for an EC2 instance are grouped together into a log stream that you can then filter or query for insights.
Log groups: Log streams are then organized into log groups. A log group is composed of log streams that all share the same retention and permissions settings. For example, if you have multiple EC2 instances hosting your application and you are sending application log data to CloudWatch Logs, you can group the log streams from each instance into one log group. This helps keep your logs organized.
Wrap Up
CloudWatch acts as a centralized repository for metrics and logs, and provides multiple options for data visualization. Metrics are sent automatically from many AWS resources, though you can send your own custom metrics as necessary. You use CloudWatch dashboards to view and analyze data, and CloudWatch Logs to aggregate and review logs from various sources.
In the next unit, you learn about how you can use CloudWatch to send alerts and automate IT processes based on statistics.
