Get to Know Geographical Maps
Learning Objectives
After completing this unit, you’ll be able to:
- Identify key components of geographical maps.
- Analyze different types of maps by considering their intended use.
- Explain the limitations of two map types.
Essential Elements of a Map
You just learned about different types of maps and their various functions. In this unit you explore the elements that compose geographical and navigational maps. We go into some detail here because these common elements establish the accuracy and effectiveness of maps and make maps a useful tool for navigation, analysis, and communication of information.
Historical Background
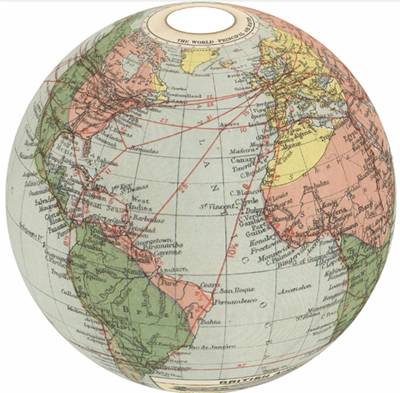
Maps have always come in a variety of shapes, sizes, and forms. But the use of grid lines on maps forever changed cartography, the practice of generating maps. Grid lines help readers better understand the connection between locations. For example, latitude and longitude (vertical and horizontal) lines created a coordinate system that enables us to mark any location on Earth on a map.
So What Exactly Are Latitude and Longitude?
Latitude lines are horizontal and run parallel to the Equator. They help you understand the vertical position of places on the globe. Latitude measures how far north or south a location is from the Equator, which is the imaginary line that runs around the middle of the Earth. The Equator is at 0 degrees latitude.
Longitude lines are also imaginary, but they run vertically from the North Pole to the South Pole, crossing over the Equator. By using longitude, you can determine the horizontal position of places on Earth. Longitude measures how far east or west a location is from a special line called the Prime Meridian. The Prime Meridian runs from the North Pole to the South Pole, passing through Greenwich, England. It has a longitude of 0 degrees. Latitude and longitude work together to generate precise coordinates that find any spot on our planet.
Another common map element is the compass rose, also known as the wind rose. Originally used on nautical maps to show the directions of the wind, the compass rose evolved with the widespread use of magnetic compasses. It became a stylistic element to indicate the direction of the North. Interestingly, in medieval times, European maps often depicted the East at the top of the compass, while maps near the Arabian Sea might show the South at the top. The cardinal direction at the top of a compass isn’t intrinsically important, as maps are stylistic choices made by humans.
Distance and Scaling
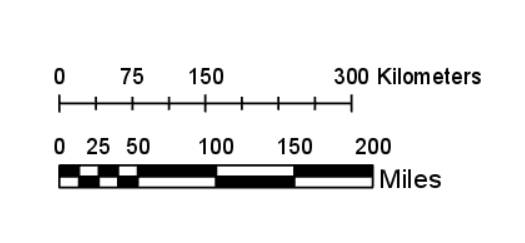
Another key element in cartography is scale. Scale bars show readers the size and proportions of places on a map. Imagine trying to locate your house on a world map–in the scale of a world map, your house would be microscopic!
Scaling is a technique that shrinks or expands sizes (and therefore distances) by a fixed amount. Think of an architectural blueprint. The blueprint isn’t life-size, but it’s at a specific scale and gives the builders all the information they need to construct the real thing. With maps, when the scale is known, the map’s distance can be converted to the actual distance with some simple math.
Map scaling bars are small lines or boxes that define how distances on a map relate to the actual distance in the real world. For example, one centimeter on a map may equal 10 kilometers of driving distance. Map scaling provides an idea of how far away places are from each other.
What scale is most useful for a map? To answer that question, once again consider the map’s purpose and what it’s trying to convey. Consider the impact that zoom-level, relevance, and generalizations may have on how you interpret what a map is saying. For example, a map of the entire state of California isn’t helpful if you’re trying to identify school zones when buying a house. Maps are generalized as simplified representations of the physical world with different levels of detail that a reader must filter out. Sometimes, the way a map is presented isn’t helpful for your specific needs.
Projection Models
Another key consideration is projection. To understand map projections, think of projection as flattening a globe onto a piece of paper (or screen) while keeping all of the geographical details. The challenge is that representing a 3D spherical shape on a 2D surface creates distortion (changes) in shape, size, and direction. Different projection models handle distortion in different ways.
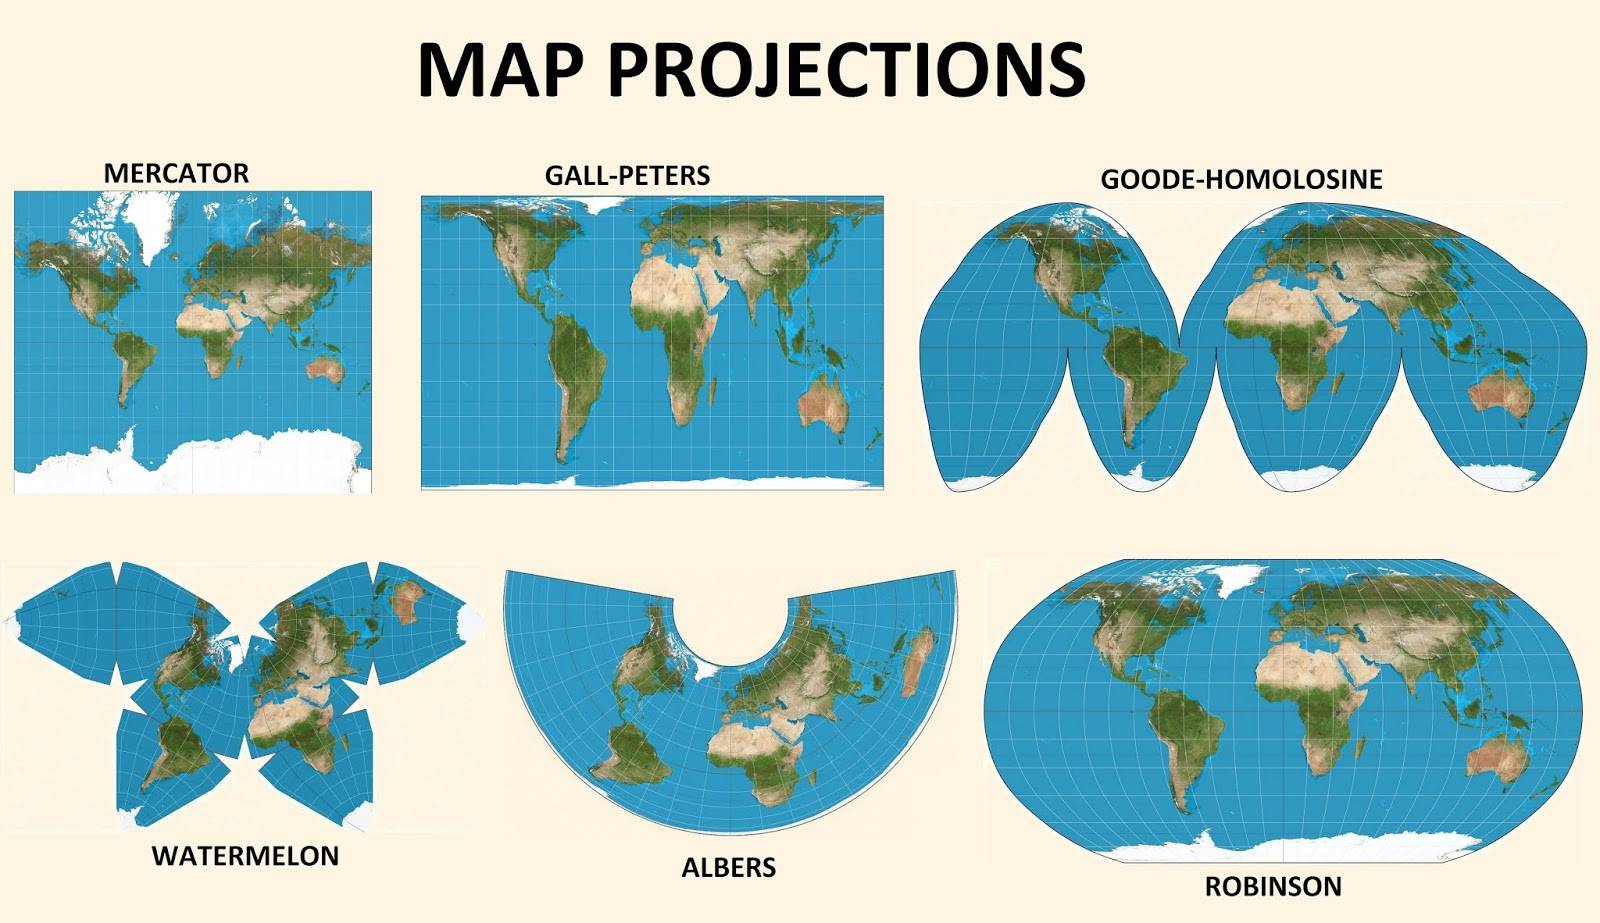
Mercator
Historically, the Mercator projection is often used for nautical and aviation charting. This model preserves straight lines and angles, which results in size distortion. This distortion makes areas around the poles appear larger than they actually are. The use of straight lines makes it easier to calculate a route.
Robinson
Another map projection model is the Robinson projection. This shows a general reference to the whole world. While there is a distortion of the shape and size of continents, specifically at the poles, this projection is easy to read and understand. It provides a more accurate representation than Mercator of how big the continents are and how expansive the oceans are.
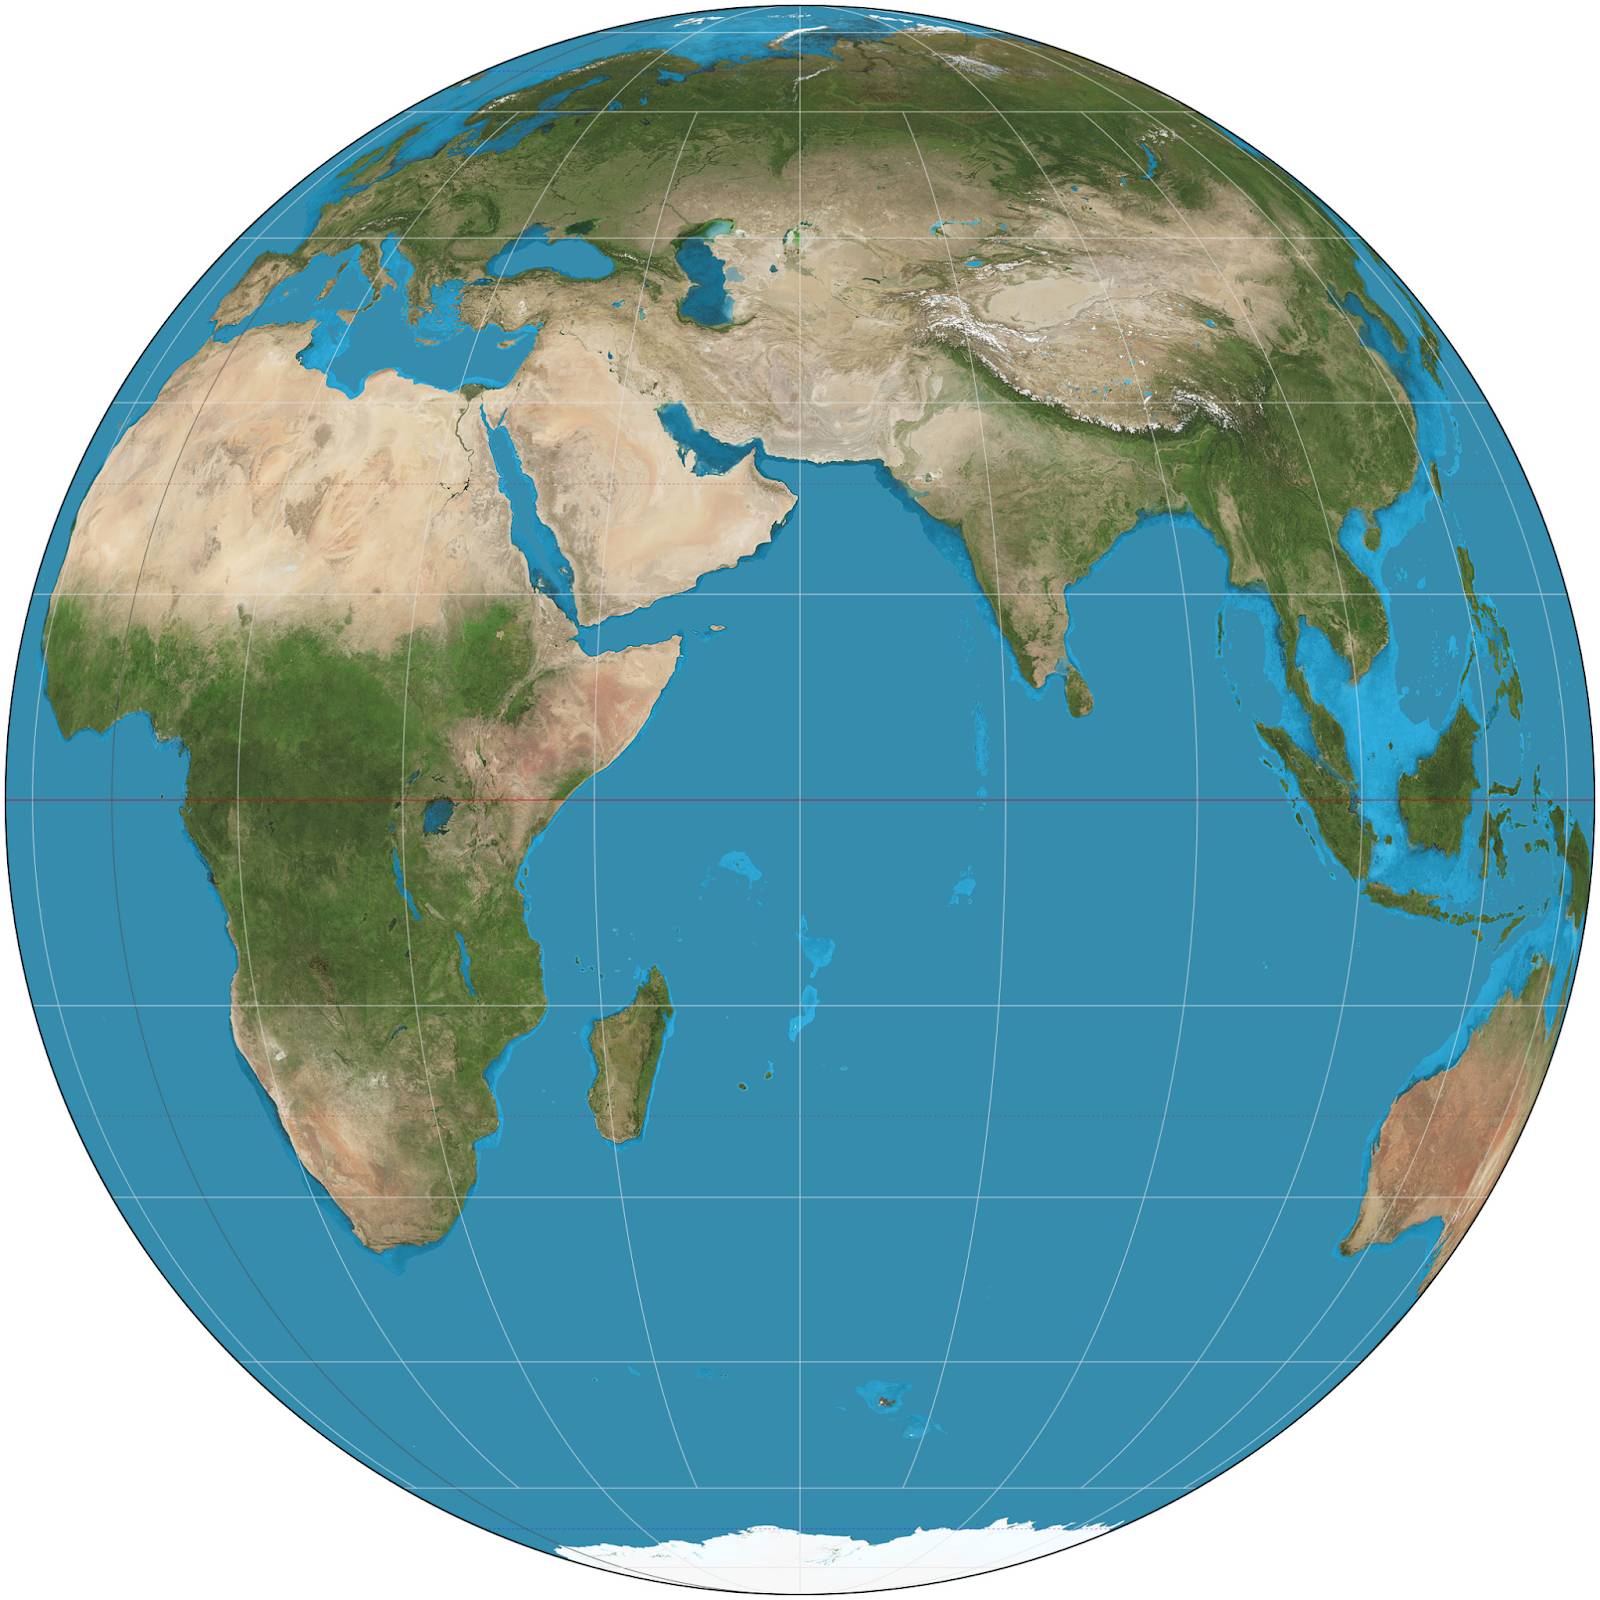
Orthographic
A different approach is an orthographic projection. This model shows the Earth as if you were looking at it from space. It creates a rounded, globe-like appearance on the map. The orthographic projection is great for representing one side of the Earth at a time, but it distorts shapes and sizes, especially near the edges. This projection is commonly used in maps on educational websites.
Intended Use
By now, you can see that a map’s intended use helps determine what the map looks like in terms of scale, detail, and projection. You’ve learned how different map projection models are appropriate for different purposes. Whether it’s for navigation, general reference, or educational materials, selecting the right projection ensures that the map serves its intended function effectively. And projections may matter more in some use cases. Projections might be necessary for planning an international flight, but they don’t typically matter for a driving map.
Let’s consider Yellowstone National Park, which is almost 2.2 million acres (3,472 square miles) of preserved land. This park receives millions of visitors each year who want to explore it in different ways. These visitors can look for different things in a park map.
- Kayaker: Shoreline details, tidal trends
- General navigation: Highway names, local landmarks
- Hiker: Trails, topography, maybe satellite/coverage info, campsites
- Day-tripper: Main roads, buildings, and points of interest
- Park ranger: Ranger stations, service coverage areas, visitor center, and all trails
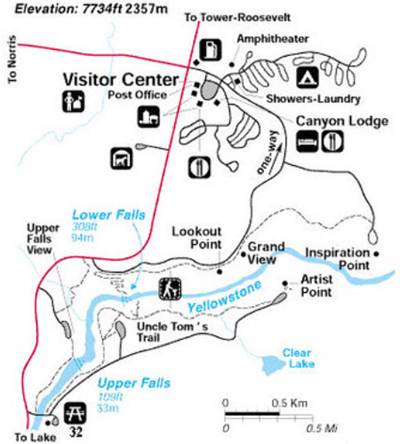
For the hiker in Yellowstone, the scale is very important. A map where 1 inch = 1 mile, compared with 1 inch = 10 miles, makes a huge difference in keeping hikers on the right path.
In the end, when you consider a map in depth, its intended use should be clear. Maps can provide a firehose of information, but sometimes you only need a trickle. Overly granular maps and simple high-level maps both have their benefits and uses.
Next, connect with your inner cartographer as you learn about mapping software.