Evaluar un modelo
Objetivos de aprendizaje
Después de completar esta unidad, podrá:
- Explicar qué es un modelo y de dónde proviene.
- Describir el motivo por el que se utilizan los indicadores para conocer la calidad del modelo.
Modelos, variables y observaciones
Para repasar lo que ha aprendido previamente en este módulo, un modelo es una construcción matemática sofisticada y personalizada que se basa en la comprensión estadística integral de los resultados pasados. Einstein Discovery genera (y entrena) un modelo basado en datos. Einstein utiliza el modelo para generar perspectivas diagnósticas y comparativas. Después de implementar un modelo en producción, puede usarlo para orientar las predicciones e impulsar mejoras en sus datos activos (hablaremos de eso más adelante). .
Variables
Vayamos a explorar los modelos más a fondo. Primero, es útil saber que los modelos organizan los datos por variables. Una variable es una categoría de datos. Se puede comparar con una columna en un conjunto de datos de CRM Analytics o un campo en un objeto de Salesforce. Un modelo tiene dos tipos de variables: datos de entrada (variables pronosticadoras) y de salida (predicciones).
Observaciones
Las predicciones se llevan a cabo en el nivel de observación. Una observación es un conjunto de datos estructurado. Se puede comparar con una fila completada en un conjunto de datos de CRM Analytics o un registro en un objeto de Salesforce.

Para cada observación, el modelo utiliza un conjunto de variables pronosticadoras como entrada (1) y devuelve una predicción correspondiente (2) como resultado. Si se solicita, el modelo puede devolver los principales pronosticadores y mejoras también. En esta ilustración, el resultado actual (IsWon) no se conoce aún.
Los modelos están en todas partes
Los modelos no son exclusivos de Einstein Discovery o Salesforce. De hecho, los modelos predictivos se utilizan ampliamente en todo el mundo (en diferentes sectores, organizaciones y disciplinas) y están involucrados en muchos aspectos de la vida diaria. Los científicos de datos y otros especialistas utilizan sus amplios conocimientos para diseñar y construir modelos de alta calidad que pueden generar predicciones muy útiles y precisas.
Sin embargo, un reto bastante habitual para muchas organizaciones es que, una vez construido, un modelo bien diseñado puede ser difícil de implementar en los entornos de producción e integrarse de manera fluida con las operaciones que tiene como objetivo mejorar. Con Einstein Discovery, ahora podrá poner a funcionar sus modelos rápidamente: desarróllelos, impleméntelos en producción y empiece a obtener predicciones y a tomar mejores decisiones empresariales ya mismo utilizando sus datos en tiempo real. Incluso puede poner en marcha los modelos construidos externamente y cargados en Einstein Discovery.
¿Qué es un buen modelo de datos?
En el caso de que vaya a basar las decisiones sobre su empresa en las predicciones que realiza su modelo, este debe ser muy bueno a la hora de predecir los resultados. Como mínimo, lo ideal es que el modelo mejore la predicción de los resultados en comparación con cuando no se dispone de un modelo, es decir, cuando se realizan suposiciones aleatorias que tienen como resultado una toma de decisiones carente de datos.
Entonces, ¿qué hace que un modelo sea bueno? En términos generales, un buen modelo cumple los requisitos de su solución al realizar predicciones lo suficientemente precisas como para ayudar a mejorar los objetivos en cuanto a los resultados. Dicho de forma sencilla, es necesario saber hasta qué punto los resultados predichos por el modelo coinciden con los resultados reales.
Para ayudarle a determinar el nivel de rendimiento de su modelo, Einstein Discovery proporciona indicadores del modelo que visualizan mediciones comunes del rendimiento del modelo. (Los científicos de datos reconocen esto como estadísticas de ajuste, que cuantifican el nivel de precisión de las predicciones del modelo en cuanto a los datos reales). Tenga en cuenta que los modelos son aproximaciones abstractas del mundo real, por lo que todos los modelos son inevitablemente imprecisos hasta cierto punto. De hecho, el modelo "perfecto" debería levantar sospechas, y no la esperanza (seguiremos hablando de esto más adelante).
Cuando pensamos en los modelos, resulta útil tener en cuenta la cita del estadístico George Box: "Todos los modelos son incorrectos, pero algunos son útiles".
Por lo que veamos cómo de útil puede ser su modelo.
Explorar el rendimiento del modelo
En Einstein Discovery, el rendimiento del modelo muestra las medidas de calidad y los detalles asociados de un modelo. El rendimiento del modelo le ayuda a evaluar la capacidad del modelo para predecir un resultado. Los indicadores del rendimiento del modelo se calculan utilizando los datos del conjunto de datos de CRM Analytics usado para entrenar su modelo. Para cada observación con un conjunto de datos (observado o real) conocido, Einstein Discovery calcula una predicción y, después, compara el resultado predicho con el resultado real para determinar la precisión.
Importante: Einstein Discovery proporciona muchos indicadores diferentes para evaluar el modelo creado por usted (de hecho, hay demasiados como para verlos todos en este módulo). No se preocupe, no tiene por qué conocerlos todos (o incluso la mayoría). En este módulo trataremos los más importantes.
Gracias a incluir un conjunto completo de indicadores, Einstein Discovery hace que su modelo sea totalmente transparente, con diversas maneras para evaluar el rendimiento desde diferentes perspectivas. De esta manera, puede evaluar la calidad del modelo a través de los indicadores que le resulten más convenientes para su solución.
Einstein Discovery también le ayuda a interpretar los indicadores sin tener que comprender todos los matices y cálculos implicados en el cálculo. Si quiere saber más sobre una pantalla o un indicador en particular que no hemos tratado en esta unidad, haga clic en el icono de información  o en Learn more (Saber más)
  .
.
Descripción general del rendimiento del modelo
El rendimiento del modelo es la primera página que ve al abrir su modelo. Utilícelo para evaluar la calidad de su modelo.

Nota: Los casos de uso de clasificación numérica y binaria tienen indicadores diferentes. En este módulo, nos centraremos en los indicadores para aumentar IsWon, un caso de uso de clasificación binaria.
El panel izquierdo (1) incluye:
- Navegación a las secciones Model (Modelo)
- Data Insights (Conclusiones de datos) y Bookmarks (Marcadores)
- Vínculos a otras acciones
El panel Path to Deployment (Proceso de implementación) (2) incluye:
-
Review Model Accuracy (Revisar la precisión del modelo): para las soluciones de clasificación binaria, la medición del área bajo la curva (AUC, por sus siglas en inglés) es lo que primero evalúan los científicos de datos para valorar la calidad del modelo. Nuestro objetivo es tener un valor AUC mayor que 0,5 (probabilidad aleatoria) y menor que 1,0 (una predicción perfecta, que, por lo general, indica un problema de filtración de datos). Nuestro modelo tiene un valor AUC de 0,8183, un valor bastante bueno.
Nota: Un indicador comparable para modelos numéricos es R^2, el cual mide la capacidad que tiene un modelo de regresión para explicar la variación en el resultado. R^2 tiene un rango que va desde cero (probabilidad aleatoria) hasta uno (modelo perfecto). Por lo general, cuanto mayor sea el valor de R^2, mejor predice el modelo los resultados.
-
Set a Threshold (Establecer un umbral): para los modelos de clasificación binaria, el umbral es el valor que determina si una predicción se clasifica como verdadera o falsa en base a la puntuación de predicción, que es un número entre 0 y 1. En nuestro ejemplo, si la puntuación de predicción es 0,4954 o más alta, el resultado predicho es TRUE (Verdadero). En este módulo, no vamos a profundizar en el tema de los umbrales. Basta con decir que, dependiendo de las necesidades de su solución, puede adaptar su modelo en favor de un resultado u otro.
-
Assess Deployment Readiness (Evaluar la preparación de la implementación): Einstein Discovery realiza una comprobación de la calidad del modelo y muestra los problemas detectados. En nuestro ejemplo, no hay alertas de datos porque ya los ha resuelto en la unidad anterior.
El panel Training Data and the Model (Datos de entrenamiento y el modelo) (3) incluye:
-
Distribution of the Outcome Variable (Distribución de las variables de resultado): muestra cuántos valores observados TRUE (Verdadero) o FALSE (Falso) (resultados reales) hay en los datos de entrenamiento.
-
Top Predictors (Principales pronosticadores): muestra las variables pronosticadoras que tienen mayor correlación con el resultado. En nuestro datos de muestra, Opportunity Type (Tipo de oportunidad) tiene la correlación más alta, seguido de Industry (Sector).
Prediction Examination (Examen de datos)
Haga clic en la pestaña Prediction Examination (Examen de predicciones).
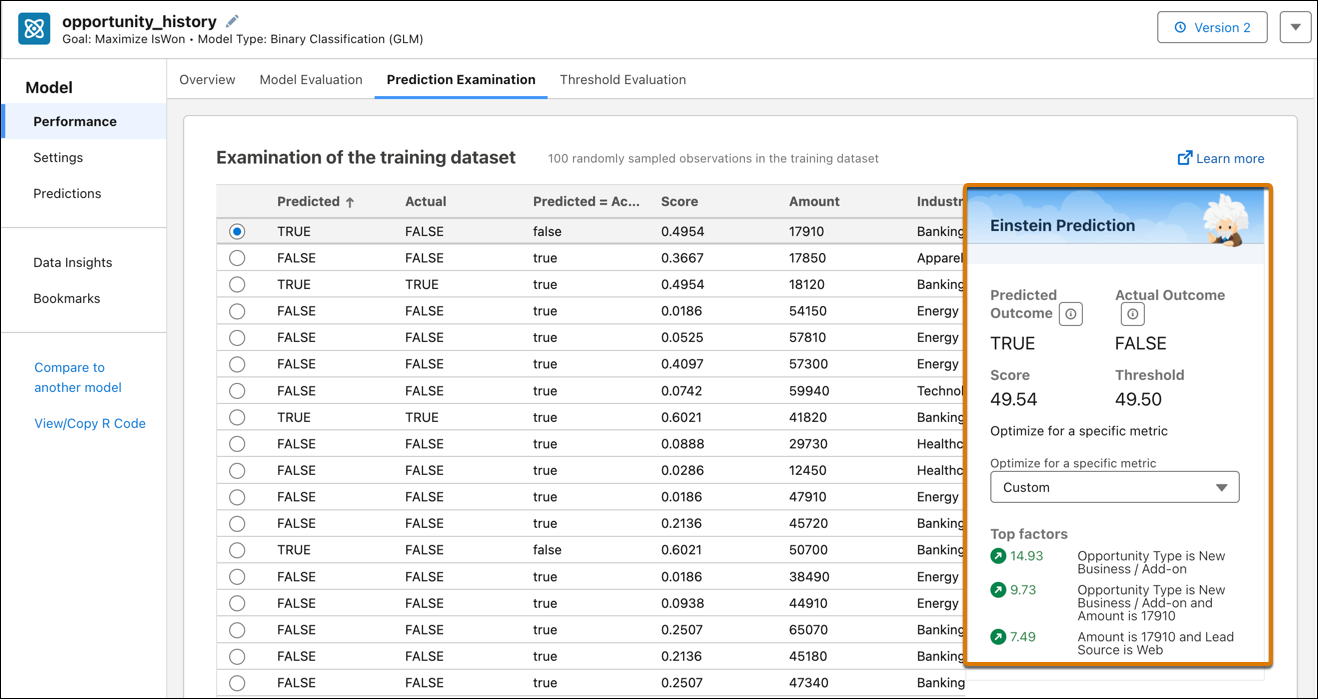
El panel Einstein Prediction (Predicción de Einstein) de la derecha compara, para la fila seleccionada en los datos de entrenamiento, el resultado predicho con el resultado real, así como los factores principales que contribuyeron al resultado predicho. Haga clic en cualquier fila para actualizar este panel.
Esta pantalla es como una simulación: es una vista previa útil de cómo el modelo realizaría predicciones de los resultados una vez que esté implementado. El valor AUC predijo una medida global del modelo, pero esta pantalla le permite profundizar y analizar las predicciones de su modelo de forma interactiva.
Nota: Einstein Discovery obtiene una muestra de datos aleatorios del conjunto de datos, por lo que los datos en su pantalla diferirán de esta captura de pantalla.
Explorar predicciones y mejoras
Utilicemos el poder de Einstein Discovery para predecir el futuro. En esta sección, vamos a poner a Einstein a trabajar seleccionando un escenario y haciendo que calcule los resultados estadísticamente probables y que nos sugiera la forma de mejorarlos.
Nota: Esta unidad recoge el uso de su modelo para explorar predicciones y mejoras hipotéticas. Más adelante, aprenderá a implementar su modelo en Salesforce para obtener predicciones y mejoras en sus registros actuales.
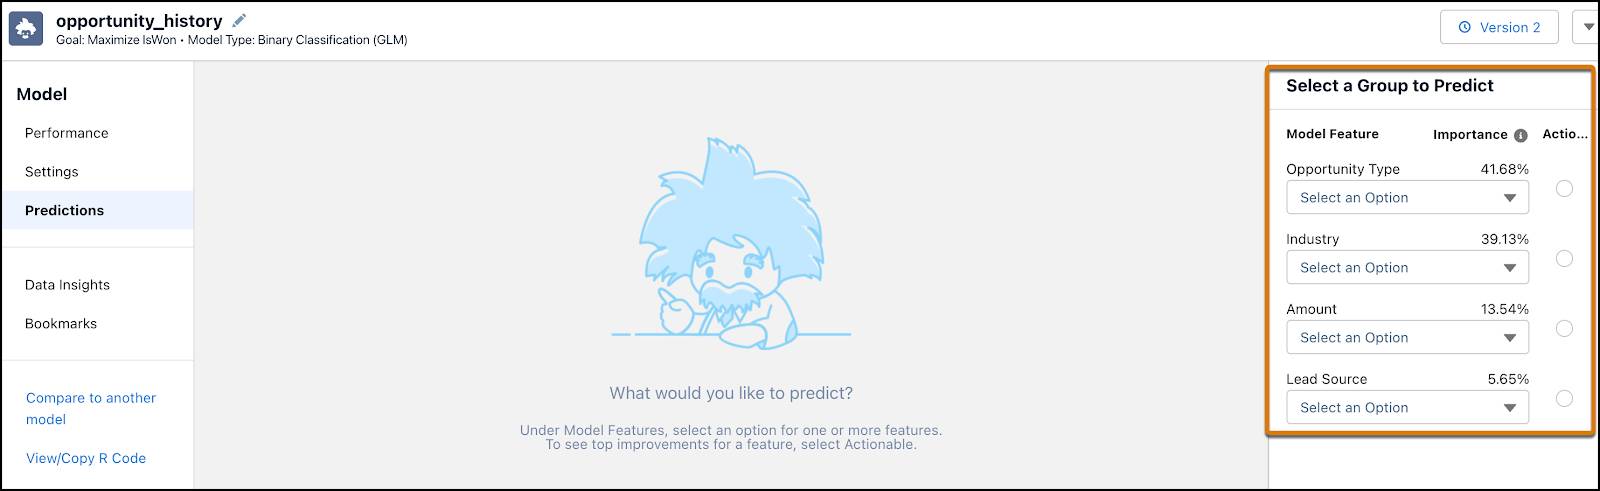
En el panel izquierdo de navegación, haga clic en Predictions (Predicciones).

El panel de la derecha es donde selecciona las entradas para el modelo.
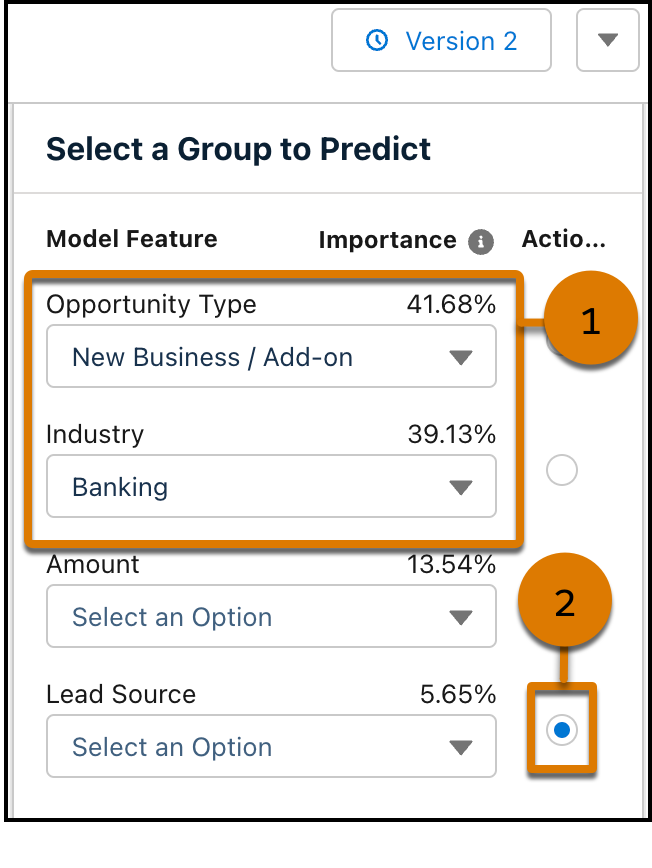
En Select a Group to Predict (Seleccionar un grupo para predecir), para Opportunity Type (Tipo de oportunidad), seleccione New Business / Add On (Nueva empresa / Agregar) y, para Industry (Sector), seleccione Banking (Banco) (1). Seleccione el botón de acción junto a Lead Source (Origen del candidato) (2) para ver las mejoras.
En la página principal ve estos paneles (es posible que necesite desplazarse hacia abajo para verlo todo).

-
Einstein Prediction (Predicción de Einstein) (1) muestra la puntuación de predicción de su opción seleccionada. En este ejemplo, el resultado predicho es IsWon: Verdadero.
-
Top Improvements (Principales mejoras) (2) muestra las acciones sugeridas que puede realizar para mejorar el resultado predicho. En este ejemplo, cambiar el origen del candidato de la oportunidad a "referencia del socio" mejora el resultado predicho a 0,067.
-
Model Overview (Descripción general del modelo) (3) muestra los indicadores de calidad del modelo.
-
Top Prediction Factors (Principales factores de predicción) (4) muestra las variables explicativas, favorables y no favorables, que están más estrechamente relacionadas con el resultado predicho. En nuestro ejemplo, establecer New Business / Add On (Nueva empresa/complemento) en Opportunity Type (Tipo de oportunidad) mejora el resultado predicho en un 14,18 %.
-
Insights (Perspectivas) (5) muestra perspectivas adicionales asociadas con su selección.
¿Qué es lo siguiente?
Ahora que ha evaluado su modelo, echemos un vistazo a las perspectivas de datos.
Recursos