Get to Know Tableau Desktop
Learning Objectives
After completing this unit, you’ll be able to:
- Identify the parts of the Tableau Desktop workspace.
- Describe the elements of a visualization in Tableau.
What Does the Tableau Interface Look Like?
What makes Tableau so popular is its intuitive and user-friendly interface. If you’re new to Tableau, you may still find all the different panes and icons and new terminology somewhat daunting. In this module, you get to know the workspace so you can build attractive and impactful data visualizations in no time.
When you open Tableau Desktop, a workbook file is automatically created. A workbook holds all of your work and contains one or more sheets, which can be a worksheet, dashboard, or story. On the right is a blank canvas, where you create your visualizations (also known as “views” or “vizzes”). Of course, there are familiar elements like menus and a toolbar, but also not-so-familiar elements, like the Data pane, cards, and shelves.
Take a look at the workspace area below to learn about the different areas in detail.
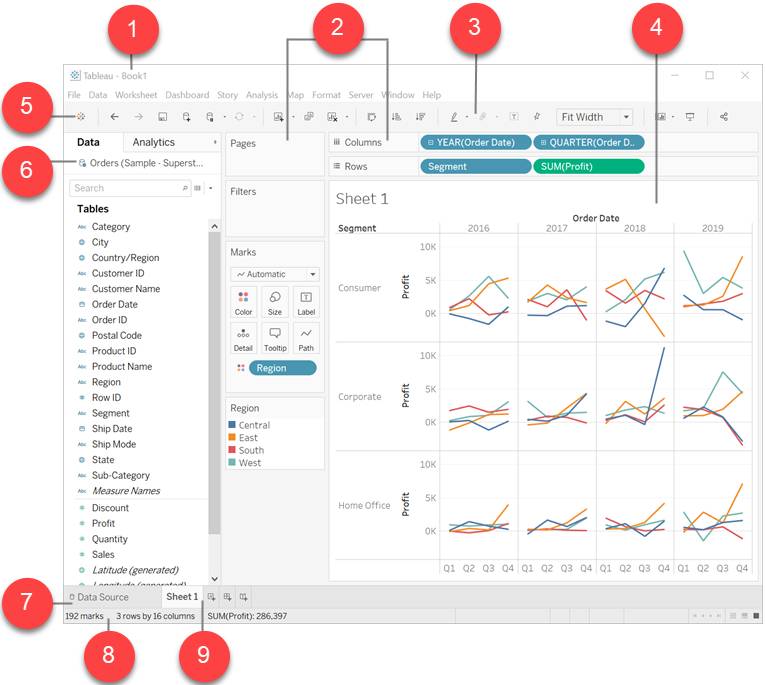
1) Workbook name: A Tableau workbook is similar to a Microsoft® Excel® workbook. It can contain one or more worksheets (or dashboards or stories) and holds all of your work. You can save it and share it just like any other file. When you open Tableau, a blank workbook is automatically created.
2) Cards and shelves: Drag fields to the cards and shelves in the workspace to add data to your view. By placing fields on shelves or cards, you build the structure of your visualization. You’ll learn more about the specific cards and shelves in a later unit.
3) Toolbar: Use the toolbar to access commands and analysis and navigation tools. For an explanation about each toolbar button, go to this toolbar reference table.
4) View: The view is the canvas in the workspace where you create a visualization (also referred to as a "viz"). The finished visualization may include charts, graphs, maps, and more.
5) This icon takes you to the Start page, where you can connect to data.
6) Side bar: In a worksheet, the side bar contains the Data pane and the Analytics pane. You can expand and collapse the side bar if you want.
7) This tab takes you to the Data Source page where you can view your data.
8) Status bar: The status bar displays information about the current view and descriptions of menu items. For example, the status bar above shows that the view has 192 marks shown in 3 rows and 16 columns. It also shows that the SUM(Profit) for all the marks in the view is $286,397.
9) Sheet tabs: Tabs represent each sheet in your workbook. This can include a worksheet, dashboard, or story.
What’s in a View?
A data view is the part of the workspace that contains your visual analysis. A view can include a chart, a graph, a map, a plot, or a text table. You build a view by dragging and dropping fields from the Data pane onto the cards and shelves of the workspace. Every view consists of the following components: Headers, Axes, Panes, Cells, and Marks. In addition to these, you can choose to show or hide Titles, Captions, Field Labels, and Legends.

1) Field label: The label of a field added to the row or column shelf that describes the members of that field. For example, Category is a field that contains three members: Furniture, Office Supplies, and Technology.
2) Title: The name that you give your worksheet, dashboard, or story. Titles display automatically for worksheets and stories and you can turn them on to display them in your dashboards.
3) Mark: The data that represents the intersection of the fields (dimensions and measures) included in your view. Marks are represented using lines, bars, shapes, and maps.
4) Legend: A key that describes how the data is encoded in your view. For example, if you use shapes or colors in your view, the legend describes what each shape or color represents.
5) Axis: This is created when you add a measure (fields that contain quantitative, numerical information) to the view. By default, Tableau generates a continuous axis for this data.
6) Header: The member name of a field.
7) Caption: Text that describes the data in the view. Captions are automatically generated and can be toggled on and off.
Now that you’re familiar with the overall layout of Tableau Desktop, let’s move on to the next unit where you learn more about the left side of the workspace.
Resources