Build Structure with Shelves and Cards
Learning Objectives
After completing this unit, you'll be able to:
- Explain how to add columns and rows to your viz.
- Use the Marks card to add layers of visual analysis to your viz.
- Filter your data to include only certain parts of your data in your viz.
- Add pages to your viz.
Create a Viz
Now that you know your way around the Data pane and Analytics pane, it's time to create your own viz. Remember: You find the main ingredients for your viz—your data fields—in the Data pane on the left side of your workbook. But where do they go and how do they get there?
Every worksheet in Tableau contains shelves and cards, such as Columns, Rows, Marks, Filters, Pages, and more. By placing fields on shelves or cards, you:
- Build the structure of your viz.
- Increase the level of detail and control the number of marks in the view by including or excluding data.
- Add context to the viz by encoding marks with color, size, shape, text, and detail.
To start a viz, you can:
- Drag fields from the Data pane and drop them onto the cards and shelves that are part of every Tableau worksheet.
- Double-click one or more fields in the Data pane.
- Select one or more fields in the Data pane and then choose a chart type from Show Me, which identifies the chart types that are appropriate for the fields you selected. For details, see Use Show Me to Start a View.
- Drag a field on the Drop field here grid, to start creating a view from a tabular perspective.

What Goes Where?
Most of the time, to add fields to your viz, you simply drag them to a shelf or card in the workspace. Feel free to experiment. Drag fields where you want them. You can always drag a field back off a shelf or card.
Columns and Rows Shelves: Where You Mix Your Data
How do you want to combine your ingredients? Use the Column and Row shelves to order the data for your viz.
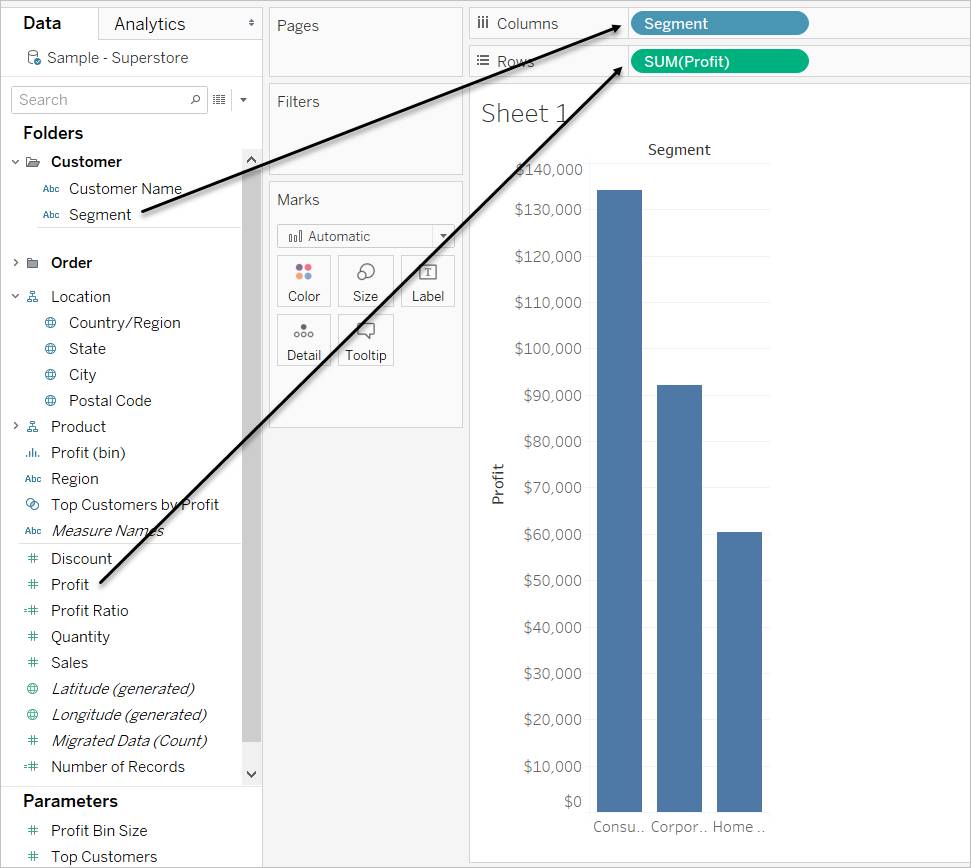
Dragging a field to the Columns shelf creates a row of column headers, or a horizontal axis. Dragging a field to the Rows shelf creates a column of row headers, or a vertical axis. You can place any number of fields on these shelves.
The kind of field you drag to Rows or Columns shelves affects what displays.
- Discrete fields (shown in blue) create headers for the members of that field.
- Continuous fields (shown in green) create axes for that field.
Adding more fields to the Rows and Columns shelves adds more rows, columns, and panes to the table.

Tableau displays data using marks, where every mark corresponds to a row (or a group of rows) in your data source. The inner fields on the Rows and Columns shelves determine the default mark type. For example, if the inner fields are a measure and a dimension, the default mark type is a bar. You can learn more by reading Change the Type of Mark in the View.
Marks Card: Get the Flavor You Want
Now that you have all of this data, it’s time to decide what you want to make with it. The choices are endless.
Use the Marks card to choose how to display data in your viz: Do you want to distinguish categories by color? With labels? Or something else? You use the Marks card to set the mark type, and to encode your data with color, size, shape, text, and detail. Not only are you making your viz attractive, you are adding layers of visual analysis to your viz by defining context and detail for the marks you use.
Suppose you dragged these fields to the Marks card: the Segment field to the Color property, the Region field to Shape, and the Quantity field to Size. Once you’ve done that, you can click the icon next to the field to view or change the property it is using. 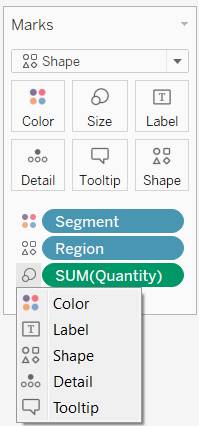
Many properties can have multiple fields. For example, you can add multiple fields to Label, Detail, Tooltip, and Color. Size and Shape can have only one field at a time.
For more information, see Change the Type of Mark in the View and Control the Appearance of Marks in the View.
Filters Shelf: Use Selected Parts of Your Data
The Filters shelf lets you include and exclude specific parts of your data.
Maybe you want to analyze the profit for each customer segment, but only for certain shipping containers and delivery times. You can drag fields to the Filters shelf to create a viz like that.
You can filter data using measures, dimensions, or both at the same time.
Let’s say you have data for three office locations, but you don’t want to display the Home Office data. You can remove this column from the viz by filtering the Segment field. To do that, drag the Segment field to the Filters shelf. When the Filter dialog box displays, uncheck the box for Home Office to exclude it from the viz.

Notice that the viz no longer includes the Home Office segment.

Pages Shelf: Serve Your Data in Courses
Tableau has a number of other shelves, cards, and controls, but let’s talk about one more: the Pages shelf.
You can use the Pages shelf to break a viz into a series of pages so you can more deeply analyze your data. When you can drag a dimension to the Pages, you’re adding a new row for each member in the dimension.
The Pages shelf creates a set of pages, with a different view on each page. Each view is based on a member of the field you placed on the Pages shelf. You can easily flip through the views and compare them. For example, you can drag DAY(Order Date) to the Pages shelf to create new pages for each day. The view below shows the Profit vs. Sales by Region for each day throughout the month. You can flip through the pages to quickly discover hidden insights, such as which days are most profitable in a specific region.

Now you know how to build a viz in Tableau. In the final unit, you'll learn how you can reorganize the workspace.
Resources