Launch Your Trailhead Playground
Learning Objectives
In this project, you’ll:
- Set breakpoints and checkpoints to step through code and inspect variable values at specific line numbers in a debug session.
- Invoke Apex tests and download debug logs using Visual Studio Code.
- Find and fix a bug using Apex Replay Debugger for Visual Studio Code.
Introduction
“Any bug not detected in the design phase will cost ten times more time to detect at the coding phase and an additional ten times more at the debugging phase.” —Dr. Nikolai Bezroukov, The Art of Debugging

Debugging and testing are related but distinct processes in software development. Testing attempts to find and report errors. Debugging attempts to identify the cause of those errors and fix them. And according to Dr. Nikolai Bezroukov, when finding and squashing bugs in your code, the earlier the better.
Apex provides testing support through a full framework for isolated execution of Apex tests, including nonproduction orgs such as sandboxes and scratch orgs. Apex also provides debugging support through the System.debug statement, debug logs, and debuggers.
When trace flags are enabled, your Apex code generates debug logs, which are recordings of all interactions in a transaction. Apex Replay Debugger simulates a live debugging session using a debug log. It presents the logged information, including variable values, call stack, and breakpoints, similarly to an interactive debugger, so you can debug your Apex code.
What Is Apex Replay Debugger?
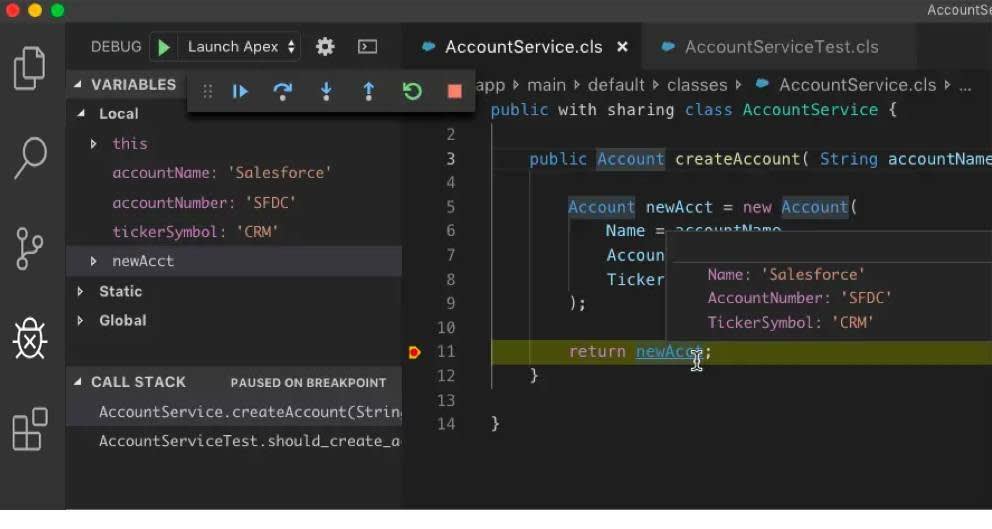
Apex Replay Debugger is a free tool that allows you to debug your Apex code by inspecting debug logs using Visual Studio Code as the client. Running the replay debugger gives you the same features you expect from other debuggers. You can view variables, set breakpoints, and hover over variables to see their current value. You no longer need to parse through thousands of log lines manually or sprinkle your code with System.debug statements to see variable values or track the code execution path.
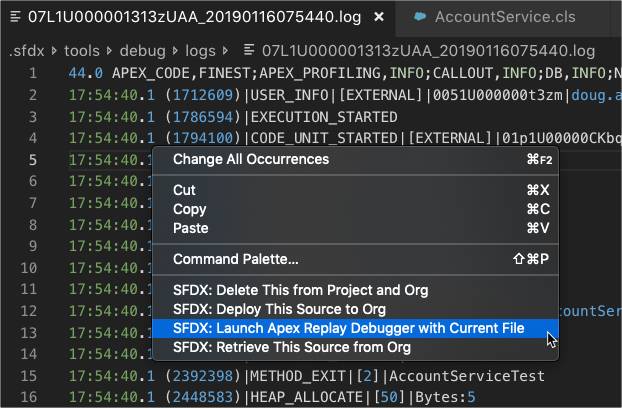
Apex Replay Debugger also makes it easy to work asynchronously and collaborate with others to solve problems. Because you can launch a replay debugger session from any replay-enabled debug log, clients and coworkers can share debug logs to help solve problems. To start a debugging session, open a debug log in Visual Studio Code and right-click any line in the file to launch the debugger.
The debugging process involves iterating through several steps. Edit your Apex code, deploy the code to your org, reproduce the buggy scenario, download the resulting debug log, then launch Apex Replay Debugger with that debug log.

What Is Apex Interactive Debugger?
Apex Interactive Debugger, also included in the Salesforce Extension Pack, allows customers to debug their Apex code on sandboxes and scratch orgs, in real time, using Visual Studio Code as the client.
Apex Interactive Debugger also comes with features for independent software vendor (ISV) partners working with subscribers who install a managed package. Because of the protections against seeing managed code, subscribers can’t debug ISV code in their orgs. With ISV Customer Debugger, an ISV can work with a subscriber to debug issues specific to the subscriber’s org.
For pricing details for Apex Interactive Debugger or ISV Customer Debugger, contact your Salesforce account executive.
This project focuses on how to set up and use the free Apex Replay Debugger.
Create Your Trailhead Playground
For this project, create a new Trailhead Playground. Scroll to the bottom of this page, click the down arrow next to Launch, and select Create a Trailhead Playground.
Resources
- External Site: Apex Replay Debugger for Visual Studio Code
- External Site: Apex Interactive Debugger for Visual Studio Code
- Video: YouTube: Banish the Bugs with the Apex Replay Debugger
- Salesforce Developers Blog: Salesforce for VS Code: Apex Replay Debugger and More
- Help: Debug Log Levels and Log Categories
- External Site: The Art of Debugging
- Trailhead: Unit Testing on the Lightning Platform