Debug Your Code
With Apex Replay Debugger configured, let’s do some testing and debugging to fix some Apex code.
Deploy Metadata to Org
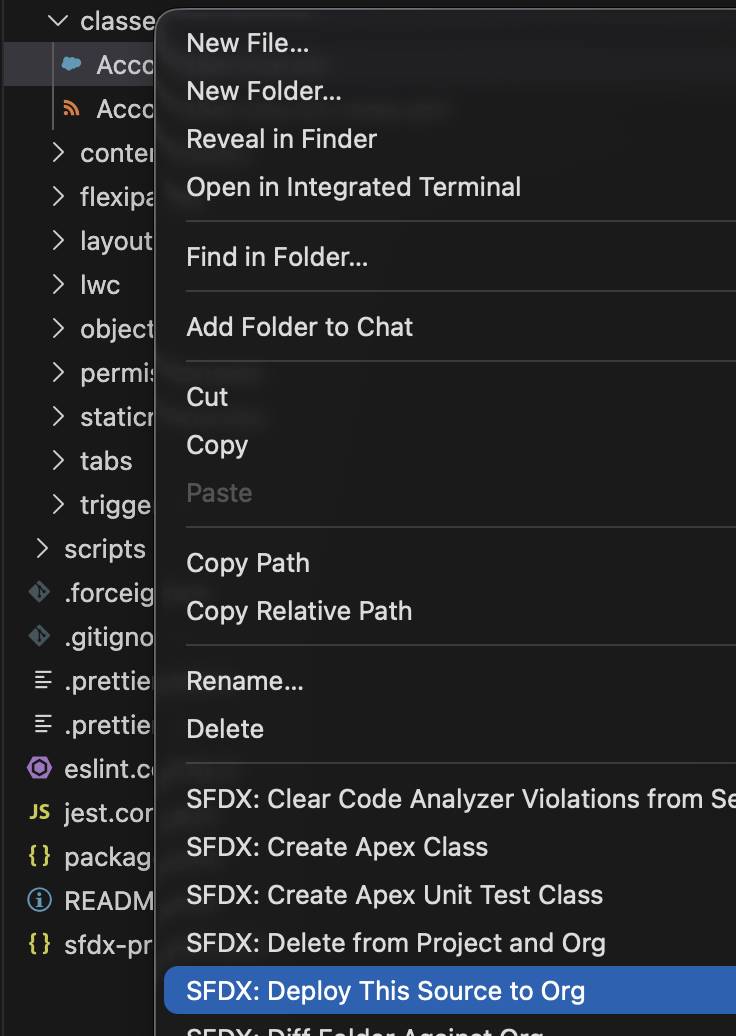
In Visual Studio Code, right-click the folder classes, then choose SFDX: Deploy This Source To Org.

Run Apex Tests
- In Visual Studio Code, click the View menu then choose Command Palette.... Alternatively, you can use the keyboard shortcut Ctrl+Shift+P (Windows or Linux) or Cmd+Shift+P (macOS) to open the Command Palette.
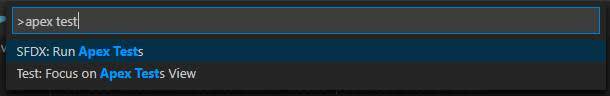
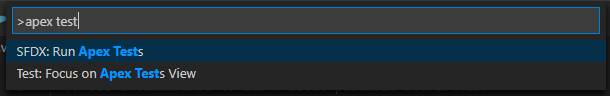
- Enter
apex testin the search box, then choose SFDX: Run Apex Tests.
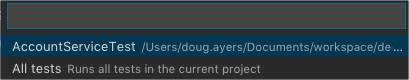
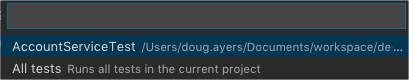
- Choose AccountServiceTest.

- Note the test result outcome in the Output panel. Uh oh, our Apex test failed! 😯
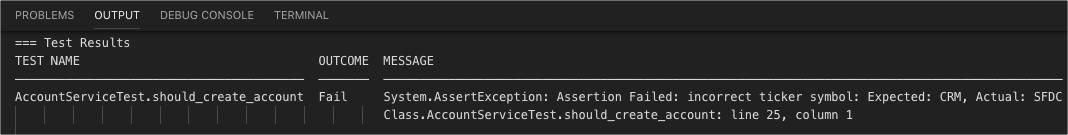
The error message indicates the wrong value was assigned to the account’s ticker symbol field. Let’s set a checkpoint in the code, rerun the test to collect a debug log, then replay the debug log to find our code bug 🐞.
Set Breakpoints and Checkpoints
When debugging, a breakpoint instructs the running program to pause at a specific line number so the developer can inspect variable values at that point in time. Checkpoints, a special feature for debugging Apex code, are a type of breakpoint that provides more information by capturing heap dumps. You can set as many breakpoints as you like, but you can only set up to five checkpoints at a time. Compared to breakpoints, checkpoints provide richer information for all local variables, static variables, and trigger context variables.
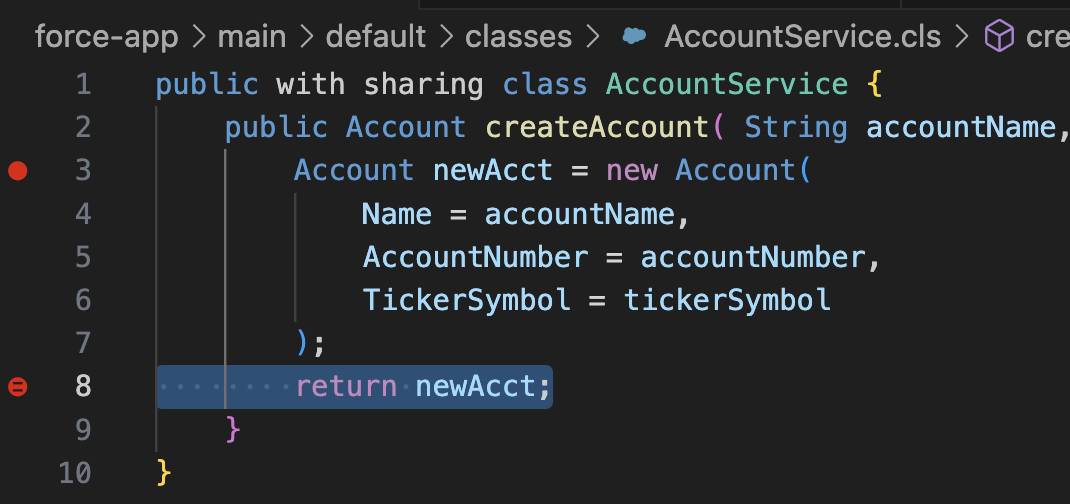
Use the Debug: Toggle Breakpoint and SFDX: Toggle Checkpoint commands to toggle on and off breakpoints and checkpoints, respectively. Breakpoints and checkpoints display an indicator next to the line number to show they’ve been set. To distinguish a breakpoint from a checkpoint, breakpoints display as a solid red dot and checkpoints display as a red circle with a line through the center.
- In Visual Studio Code, open the
AccountService.clsfile.
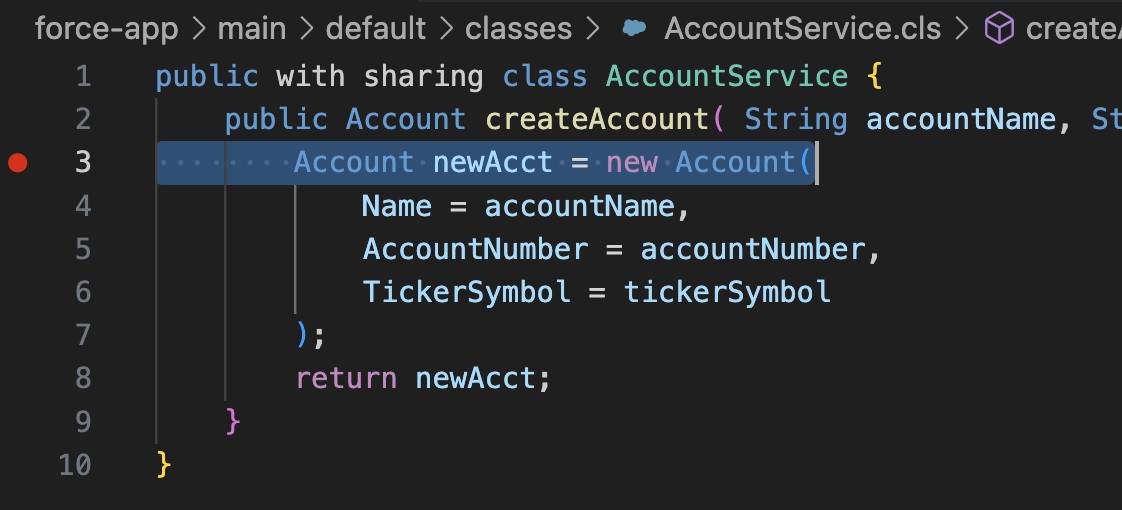
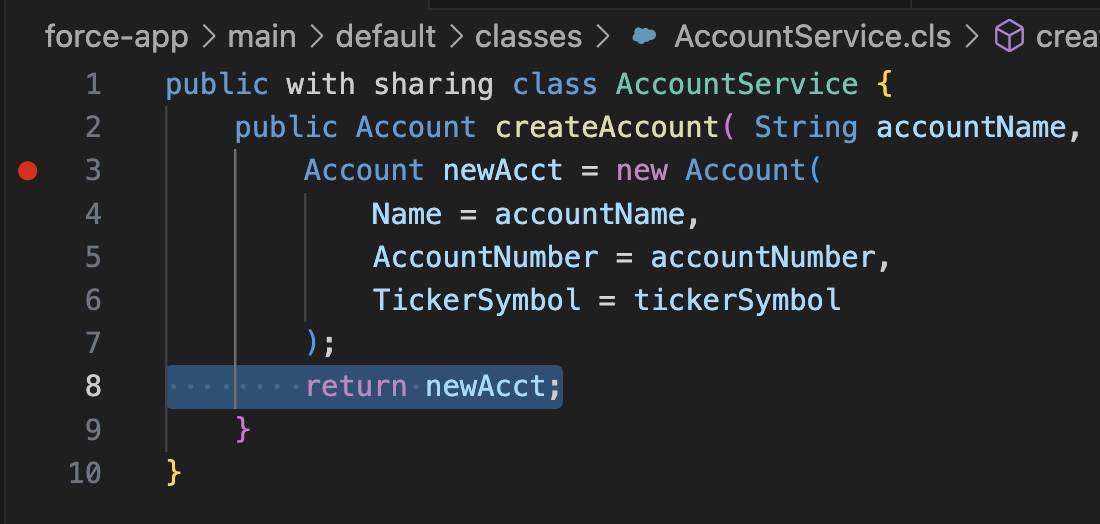
- Set a breakpoint by clicking to the left of the line number for the line with the
Account newAcct = new Account(.
- Focus your cursor on the line with the
return newAcct;statement.
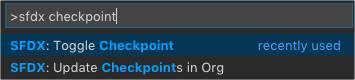
- Open the Command Palette.
- Enter
sfdx checkpointin the search box, then choose SFDX: Toggle Checkpoint.
You should see an indicator next to the line number showing that the checkpoint was set.
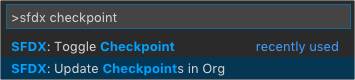
- Open the Command Palette and enter
sfdx checkpointin the search box, then choose SFDX: Update Checkpoints in Org. You must tell Salesforce about your checkpoints so that heap dumps are collected as your Apex code executes. If you modify your Apex code or toggle checkpoints, run this command again to stay in sync.
Run Apex Tests and Get Debug Logs
With our breakpoints and checkpoints set, it’s time to rerun our Apex test to generate a replay-enabled debug log.
- In Visual Studio Code, click the View menu then choose Command Palette.... Alternatively, you can use the keyboard shortcut Ctrl+Shift+P (Windows or Linux) or Cmd+Shift+P (macOS) to open the Command Palette.
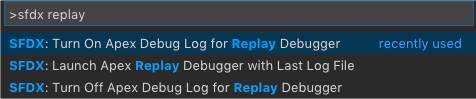
- Enter
sfdx replayin the search box, then choose SFDX: Turn On Apex Debug Log for Replay Debugger. This creates a trace flag to generate replay-enabled debug logs for 30 minutes. You can change the duration in Setup on the Debug Logs page.
- Open the Command Palette and enter
apex testin the search box, then choose SFDX: Run Apex Tests.
- Choose AccountServiceTest.
- We haven’t changed our Apex code, so we should expect the test to fail again. What has changed is that we now have a replay-enabled debug log and checkpoints to help us find and fix the bug 🐞.

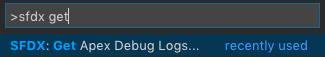
- Open the Command Palette and enter
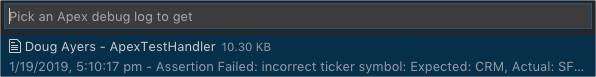
sfdx getin the search box, then choose SFDX: Get Apex Debug Logs.... After a few seconds, you are prompted to select a debug log to download.
- Choose the debug log associated with the recent Apex test run; usually this is the first entry in the list. After a few seconds, Visual Studio Code opens the downloaded debug log.
Replay an Apex Debug Log
In this step, you replay the debug log that you recently downloaded. However, the debug log that you replay could easily have been generated and shared with you by another developer on your team.
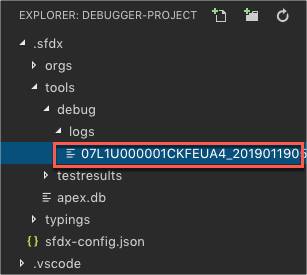
- In Visual Studio Code, open the debug log downloaded in the previous step, if it’s not already open. You can find other debug logs you’ve downloaded with Visual Studio Code in the
.sfdx/tools/debug/logsfolder.
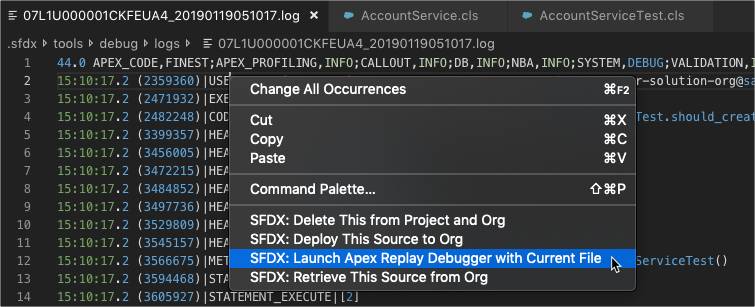
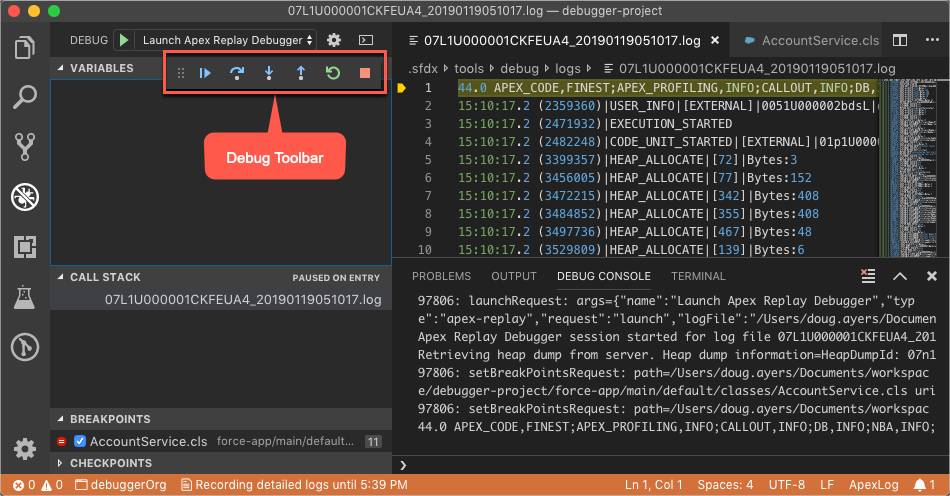
- Right-click any line in the debug log, then choose SFDX: Launch Apex Replay Debugger with Current File. After a few seconds, Visual Studio Code opens the Debug sidebar, ready for you to begin stepping through the code.
- Click
 on the Debug Toolbar to continue to the first breakpoint. If you set multiple breakpoints, continue to click
  until the debugger arrives at the checkpoint for the
 return newAcct;statement in AccountService.cls.
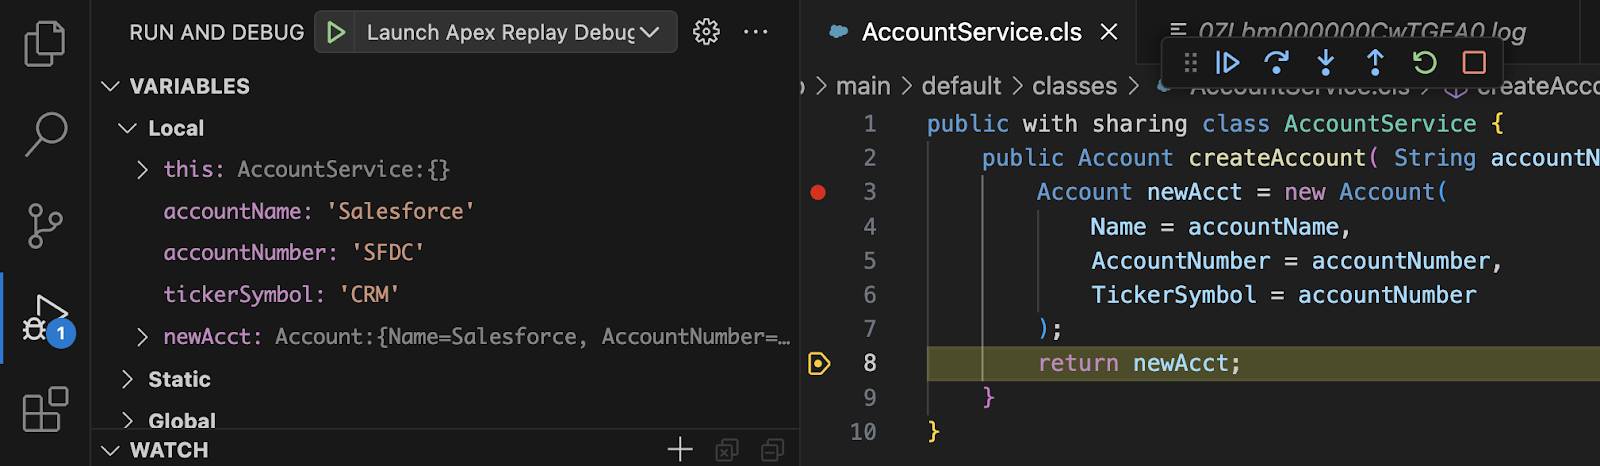
- Apex Replay Debugger pauses on the line with the
return newAcct;statement in AccountService.cls, where you set the checkpoint in a previous step. The Debug sidebar displays the current variable values in scope. We confirm that thetickerSymbolargument passed to thecreateAccountmethod has the expected value 'CRM', so we know our code is passing in the correct value to the method. So far, so good. 🙂
- In the Debug sidebar, expand the newAcct variable and note that the
TickerSymbolproperty value 'SFDC' does not match thetickerSymbolargument value 'CRM' passed to thecreateAccountmethod. Interesting. 🤔
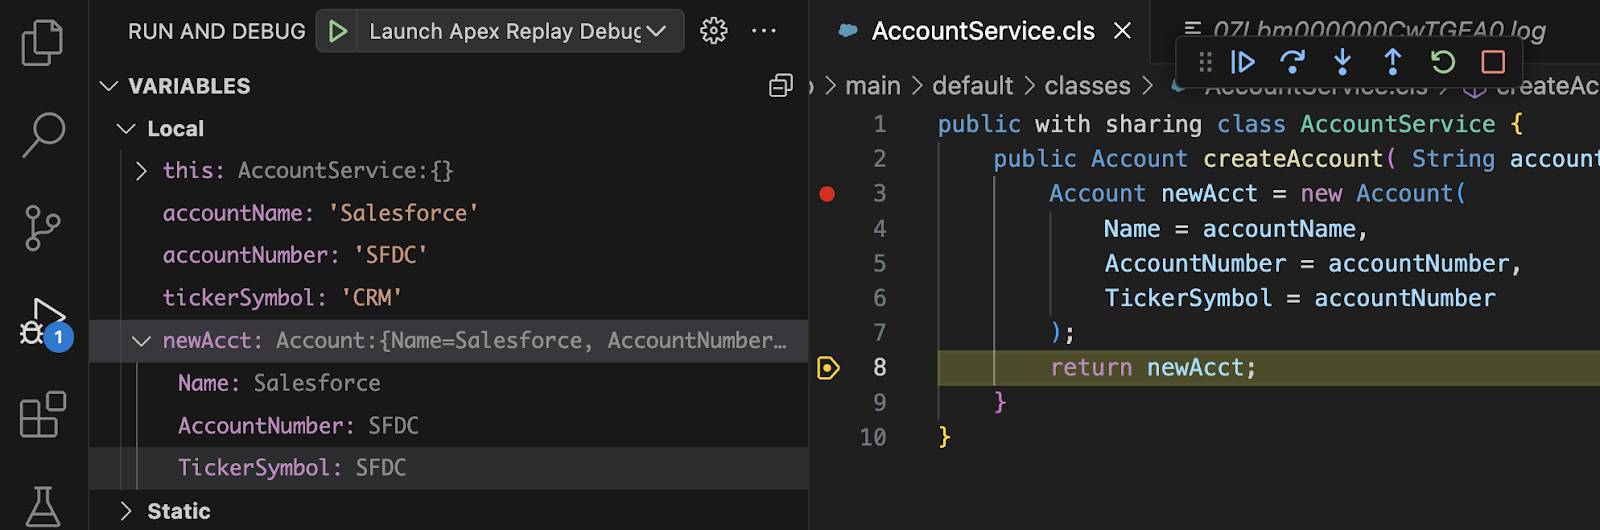
- Inspecting the code of AccountService.cls we see there’s a typo—the code is assigning the wrong argument:
TickerSymbol = accountNumber. We’ve found our bug! 🐞
- Click
 on the Debug Toolbar to end the debugging session.
Deploy Fixed Metadata to Org
- Correct the code in AccountService.cls to assign the
tickerSymbolargument to theTickerSymbolfield.TickerSymbol = tickerSymbol
- Save the file.
- Right-click any line in the file, then choose SFDX: Deploy This Source to Org.
Run Apex Tests to Verify Fix
With our updated code deployed, it’s time to rerun our Apex test to verify the fix.
- Open the Command Palette.
- Enter
apex testin the search box, then choose SFDX: Run Apex Tests.

- Choose AccountServiceTest.
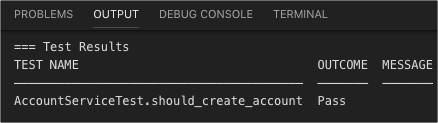
- Note the test result outcome in the Output panel. Hooray, our Apex test passed! 🥳
That’s it, you’re done! You just developed, tested, and debugged Apex code using Apex Replay Debugger and Salesforce Extensions for Visual Studio Code.
Click Verify Step to confirm the debug session with your hands-on org and to collect your badge.
Resources
- External Site: Apex Replay Debugger for Visual Studio Code
- Video: YouTube: Banish the Bugs with the Apex Replay Debugger
- Video: YouTube: Salesforce Development with Visual Studio Code
- Video: YouTube: Be An Efficient Salesforce Developer with VS Code
- Apex Developer Guide: Debugging Apex
- Help: Set Up Debug Logging
- External Site: Debugging in Visual Studio Code