Define and Create Metrics in Tableau Next
Learning Objectives
After completing this unit, you’ll be able to:
- Define what metrics are and their role in data analysis.
- Describe how to create metrics in a semantic model to use in Tableau Next.
Understanding Metrics
Metrics are quantifiable measures that help you track your business performance and progress toward specific goals. Often referred to as key performance indicators (KPIs), metrics provide an at-a-glance view of important aspects of your business as they shift and change over time.
With Tableau Next, you can easily create metrics to monitor your KPIs and see them consistently in your reports and dashboards. Each metric includes the specific data that you’re tracking (such as total sales or number of orders) and the time frame you’re measuring it over (such as daily, monthly, or yearly). For example, you might create a metric to track sales performance for all your stores to see if you’re hitting your targets. You can also break down that metric to get more detail, such as creating separate metrics for each store to see which ones are contributing the most to overall sales.
How Metrics Enhance Business Insights
Metrics add meaningful context to your raw data, such as whether an increase in a certain value is good or bad. This added context makes it easier to understand the story that your data is telling. It also helps you spot trends and problems without having to dig through piles of data.
With metrics, everyone can see and understand data the same way. Using a consistent foundation—almost like a shared business language—metrics ensure that everyone has a single, reliable source of truth.
Create Metrics
To monitor KPIs in Tableau Next, you must first create metrics to track their corresponding data points. You can create metrics in Tableau Next from a semantic model, or in Data 360 from the Semantic Layer tab.

To learn how to create and manage semantic models in Tableau Next, check out the Semantic Models in Tableau Next: Quick Look.
All of the semantic models available to you—regardless of where they were built—display in a list in your Tableau Next workspace.
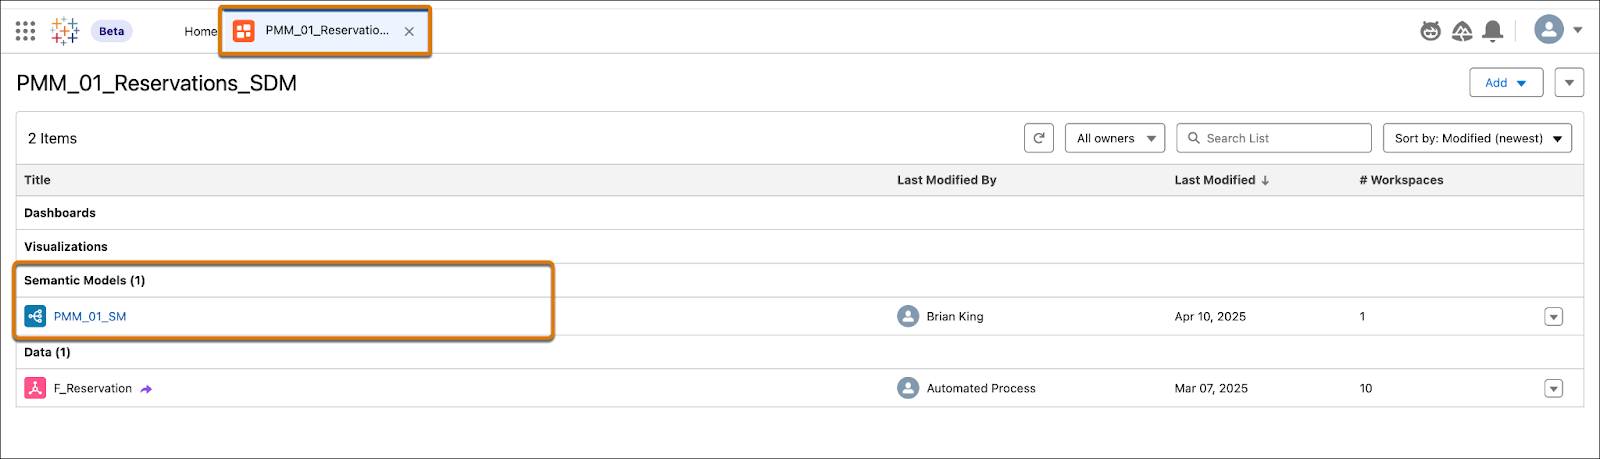
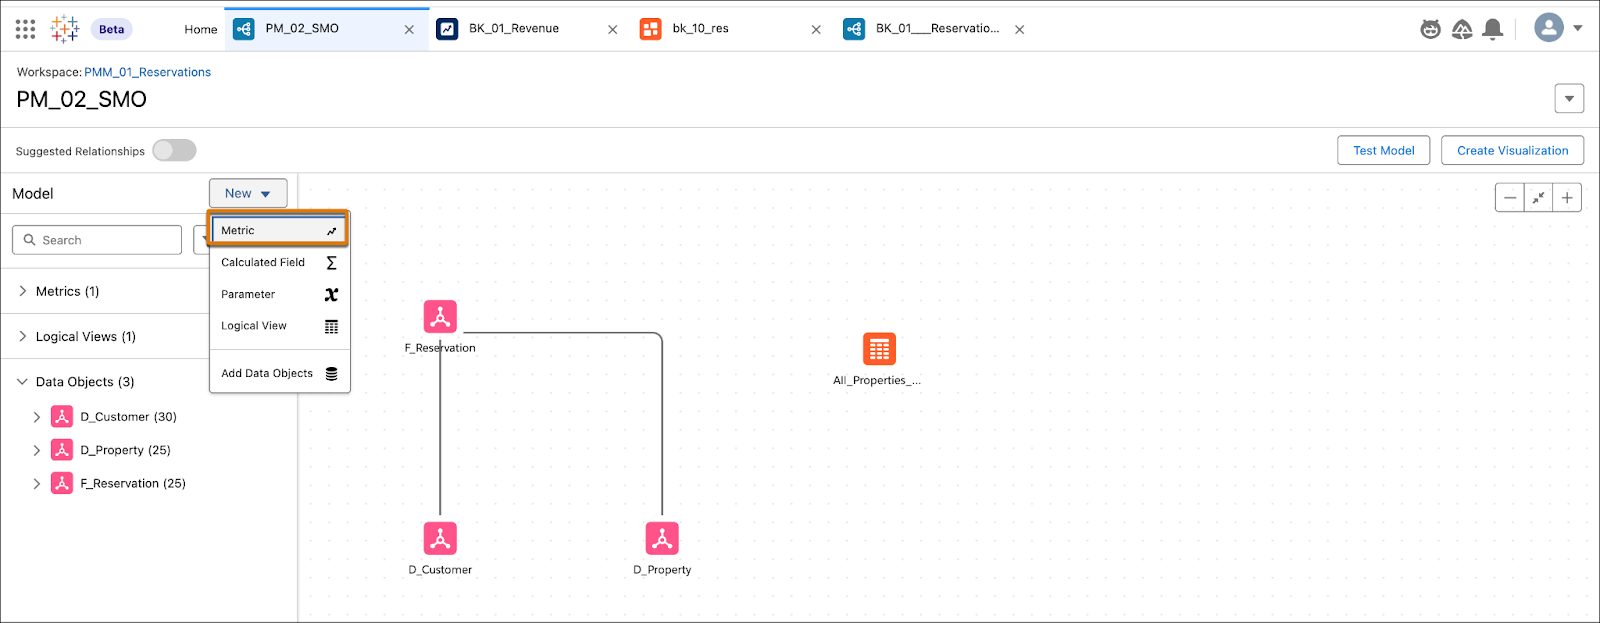
To get started, open the desired semantic model from your list. From the New dropdown, select Metric.
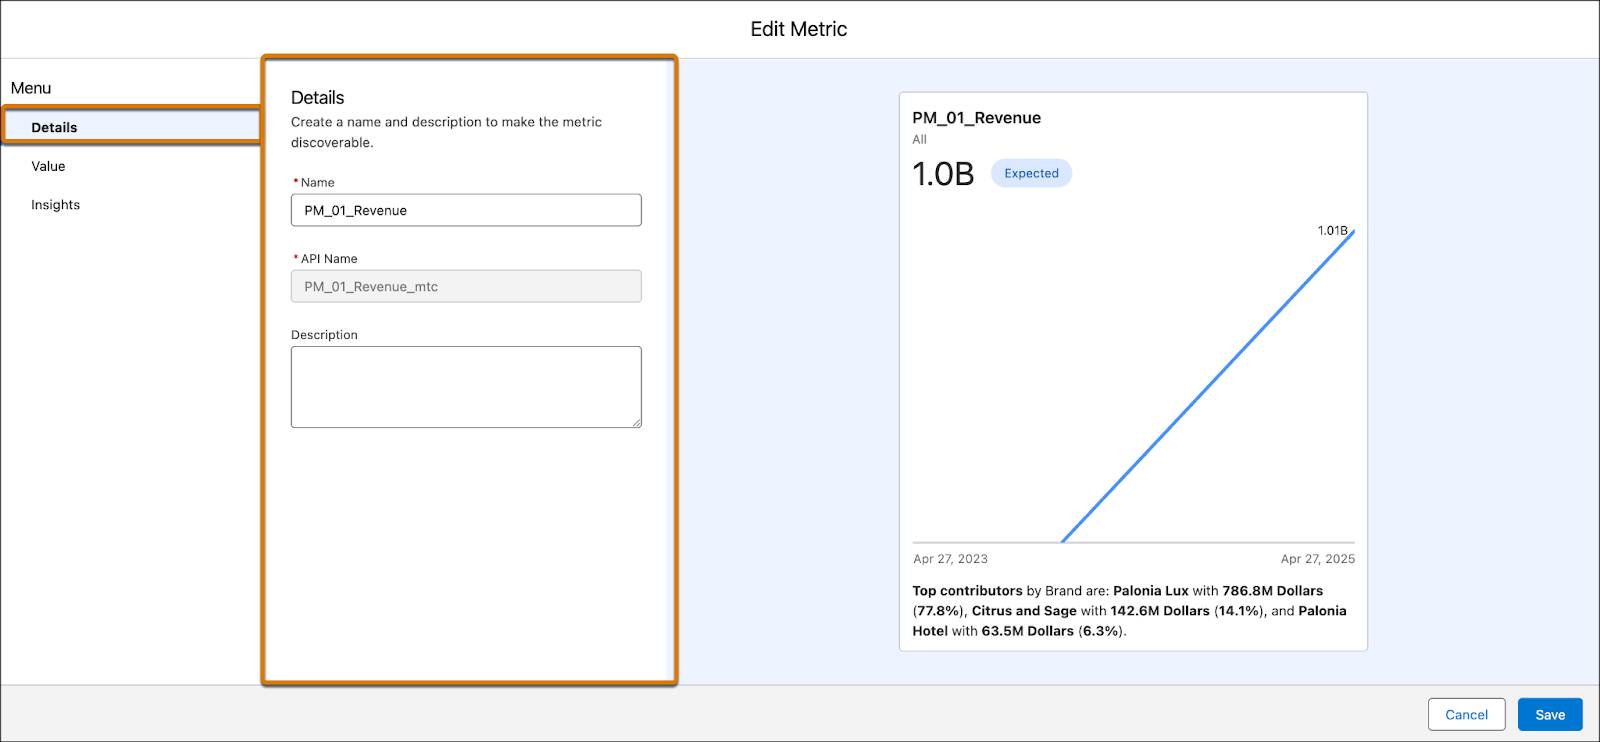
In the Details pane of the New Metric window that opens, begin defining the metric. First, add a name and description (optional) for your metric.
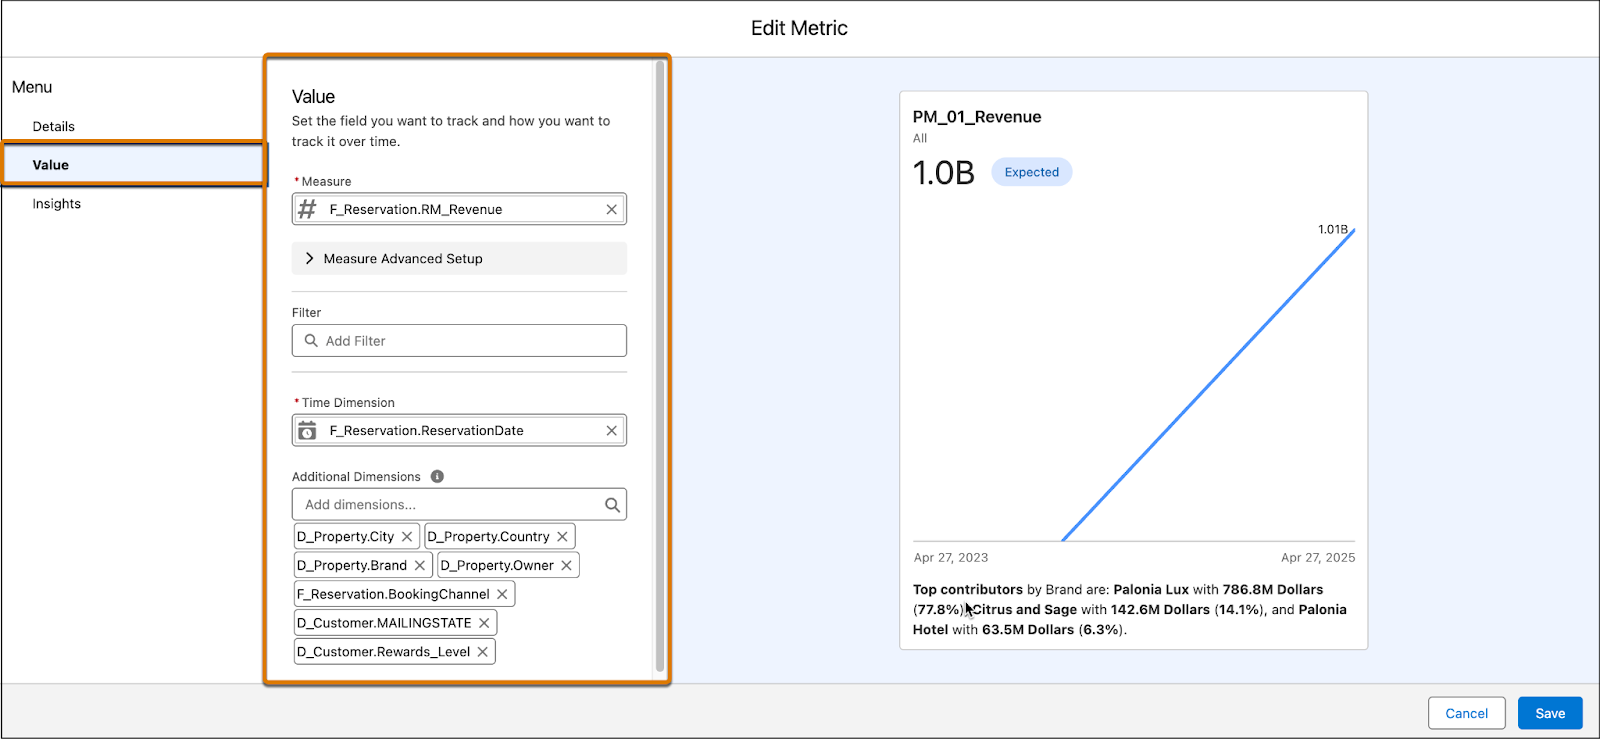
Next, open the Value pane and set:
- The measure or calculated field that represents the desired KPI.
- A time dimension that tracks its progression over time.
Finally, add insights to display on top of the metric in the Insights pane. Valuable insight options include trend change alerts, top and bottom contributors, top and bottom drivers, and more.
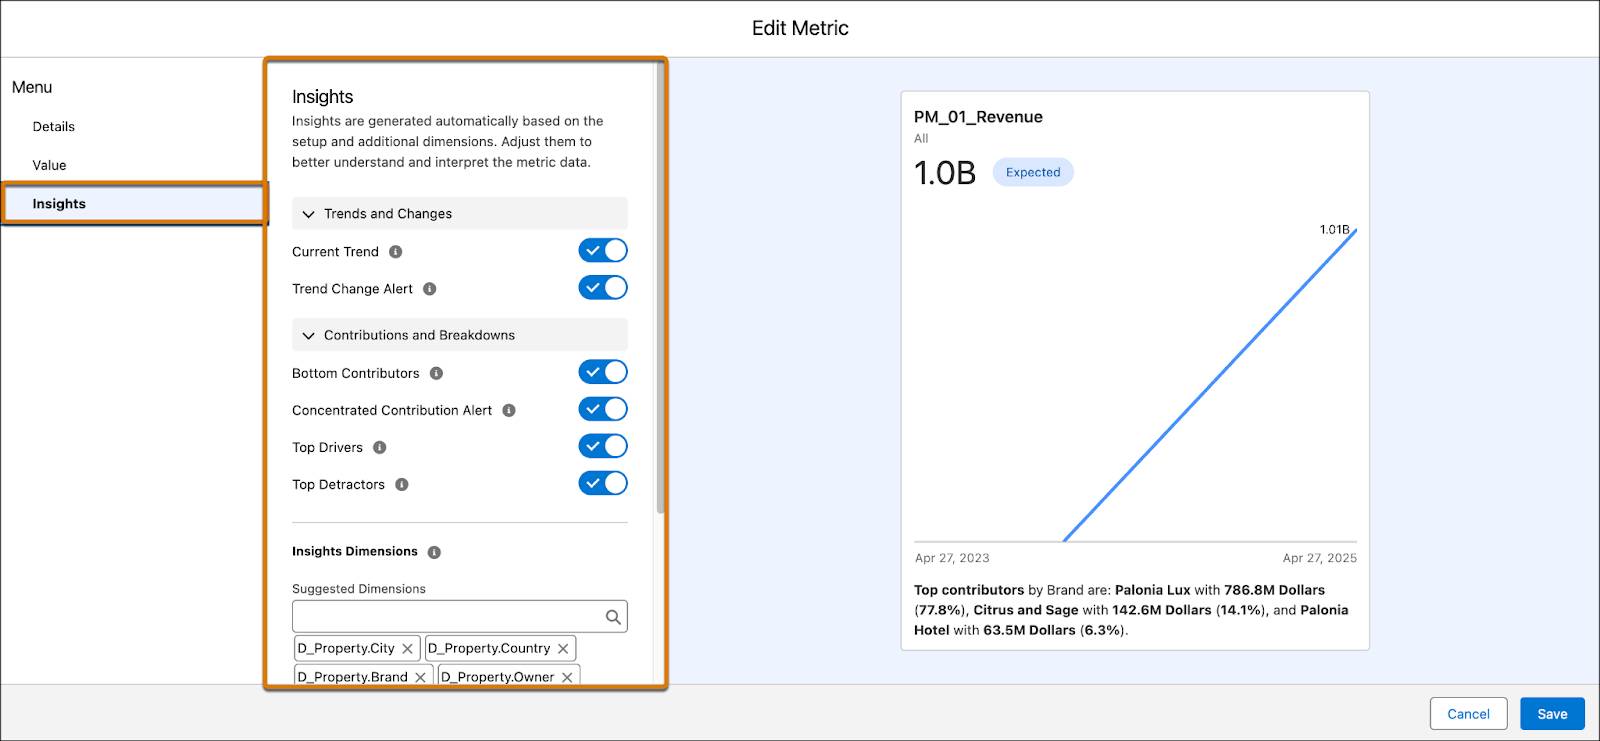
When you finish creating your metric, click Save. Then, you can view your newly created metric on your home page in Tableau Next.
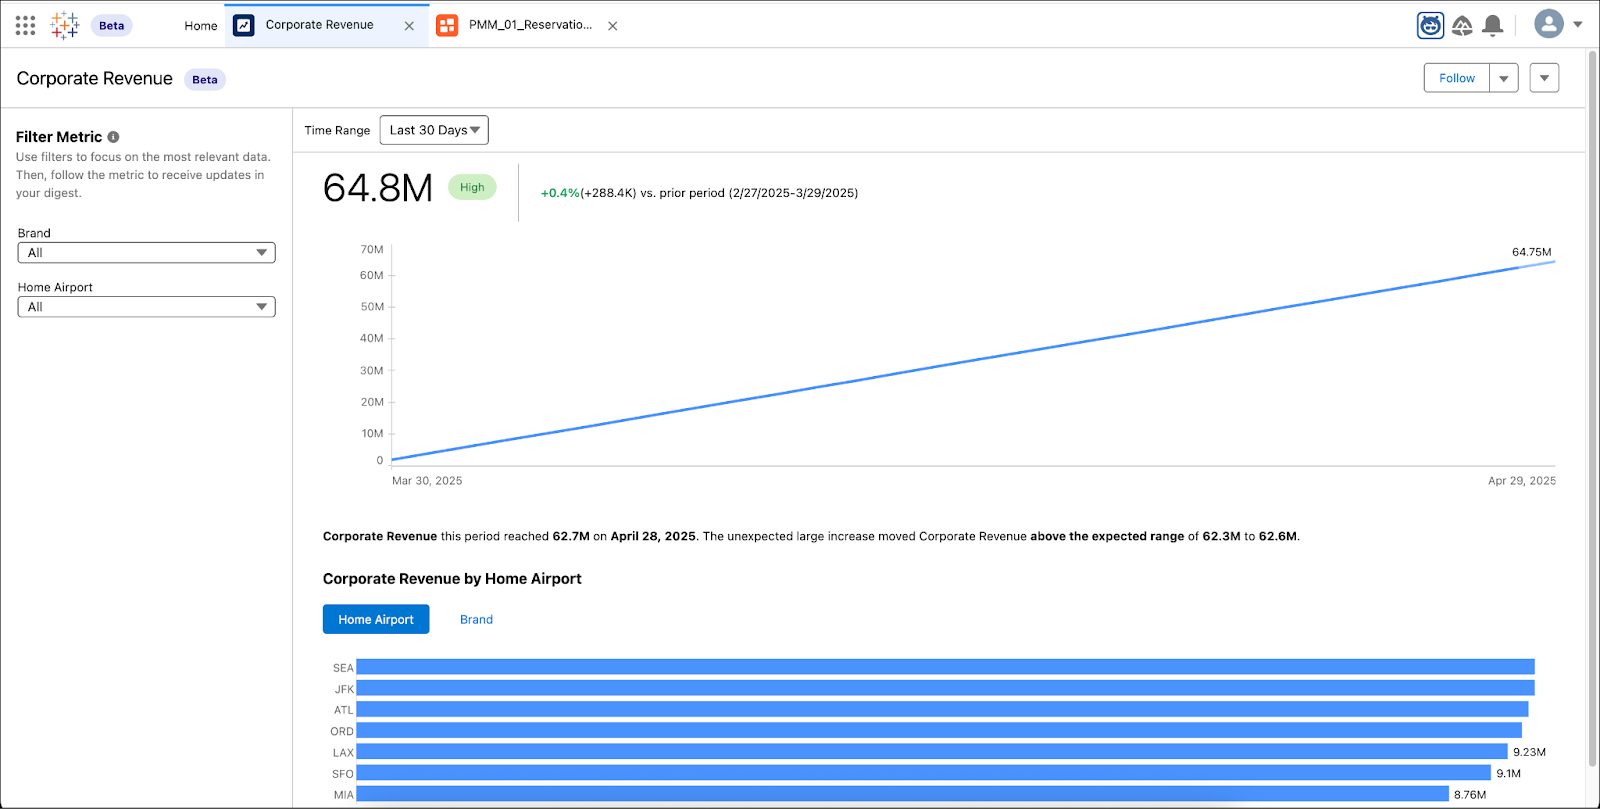
Your metric is now built, so you and your team can start using it! In the next unit, learn how to use Tableau Next to get the most out of your metric.