Learning Objectives
After completing this unit, you’ll be able to:
- Use visual exploration best practices to validate and understand data.
- Validate data at different levels of detail.
- Change mark type encoding.
Check: Connect Your Tableau Public Account
If you haven’t already, or if the playground has timed out, log into your Tableau Public account in the Playground window to the right. If you don’t already have a Tableau Public account, sign up for one now, and be sure to activate your account before starting this interactive unit. You can find more detailed instructions in The Tableau Data Model.

Validate the Details
In the Great British Bake Off, each episode gives the bakers three challenges: the Signature, the Technical, and the Showstopper. For the Technical, each baker makes the same thing. But for the Signature and the Showstopper, they’re told the parameters of what to make and they have to come up with their own bake.
Narrow the Viz to Find the Data You Want
Let’s explore this data and ensure all the fields in the data source are clearly named to reflect their content. Remember, you can use the carets next to the table names to expand or collapse them and you can adjust the width of the Data pane to make navigating the fields easier.
In the ChallengeBakes table, the Season Episode field is a single field that labels each season and episode, such as s3e10 for season 3 episode 10.
- From the ChallengeBakes table, drag Season Episode to the Rows shelf.
- From the Episodes table, drag Showstopper to the Rows shelf to the right of Season Episode. The Showstopper field is a description of what the bakers were asked to bake.
Curious about those Abcs you see? Those are placeholders for marks. Right now, you’re just exploring the structure of the data and building headers. Ignore the Abcs for now, we’ll get back to them.
- This viz now has one row per season-episode. Scroll down to season 3 episode 10 (s3e10). The Showstopper field’s value is Chiffon Cake. That’s what bakers were asked to make for the s3e10 Showstopper challenge. Let’s narrow the viz down to just that value.
- Right-click the words Chiffon Cake and select Keep Only. Keep Only adds a filter for the Showstopper field that is automatically set to only include the value Chiffon Cake.
- Now let’s look at the other Showstopper field. In the search bar at the top of the Data pane, type
show. This filters the Data pane. Showstopper (ChallengeBakes.csv) should be visible under the ChallengeBakes table.
- Drag Showstopper (ChallengeBakes.csv) to the Rows shelf to the right of Showstopper. The Showstopper (ChallengeBakes.csv) field is a description of what each baker made for that chiffon cake Showstopper challenge.
- Clear the search bar by putting your cursor in the Search field and clicking the x that comes up. Clearing searches when you’re done is a best practice to ensure you have a tidy workspace.
Update Marks
Episode 10 was the finale, so there were only three bakers left, and the viz now has only three rows. Those bakers baked a Family Reunion Chiffon Cake, a Heaven and Hell Chiffon Cake, and a United Chiffon Cakes.
But who baked each cake?
- Search for
Bakerin the search bar (or open the Bakers.csv table).
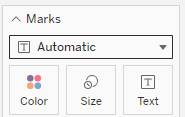
- From the Bakers.csv table, drop Baker onto the Text shelf under Marks (it's next to Color and Size).
- Then clear your search.
You should have seen that action replaced those Abcs with the baker's names! Those names are text marks. Marks can also be dots, bars, lines, and other visual elements you might be more used to seeing in a chart or graph.
- On the Marks card, click the T icon in front of the Baker pill.
- Change it to Color. Now you have a colored square mark per baker and a color legend with their names.
With this viz, you’ve verified that the two Showstopper fields contain different information at different levels of detail.
- Showstopper from the Episodes table is the description of the assignment, with one per episode.
- Showstopper from the ChallengeBakes table is the description of a baker’s recipe, with one per baker per episode.
It’s a good idea to rename the fields in the ChallengeBakes table so it’s clear that they’re the individual bakes for each baker in each challenge, not the episode-level descriptions for each challenge.
Update Fields
Rename the fields so the data is more clear.
- In the Data pane, right-click Showstopper (ChallengeBakes.csv) and rename it
Individual Showstopper.
- Repeat to rename the field Signature Bake as
Individual Signature.
Rename the Sheet for Clarity
Finally, rename the sheet to ensure you and your stakeholders know what the viz is.
- Double click the words Sheet 1 at the bottom of the screen.
- Rename the sheet
Validation.
- Then click anywhere off the sheet tab.
Great job! You’ve cleaned up the data significantly, making it easier to work with. Along the way, you’ve gotten more familiar with how metadata management works in Tableau.