Review Deal Health with Pipeline Inspection
Learning Objectives
After completing this unit, you’ll be able to:
- Explain how Pipeline Inspection helps sales teams understand deal health.
- List features that enable sales managers to coach sales reps to close more deals.
- Know where to find recent changes in opportunities and overall pipeline.
The Pipeline Inspection Experience
The Pipeline Inspection experience provides an all-in-one single pipeline view, with multiple filtering options and key opportunity changes and insights about the health of your deals. After you access this page, you’re ready to get more insight into the Haven Enterprises opportunity. In Pipeline Inspection, recent changes to opportunities are highlighted, such as changes to amounts, close dates, opportunity stages, forecast categories, and more.
What immediately pops up is that the amount has increased recently.

You dig into the opportunity’s insights panel to learn more about the health of the deal. The insights panel shows deal insights, including AI-based insights as well as insights from call recordings, emails, and service cases.

Insights That Help Close Deals
While the deal seems to be making good progress, an insight from a recent call indicates that a competitor was mentioned.
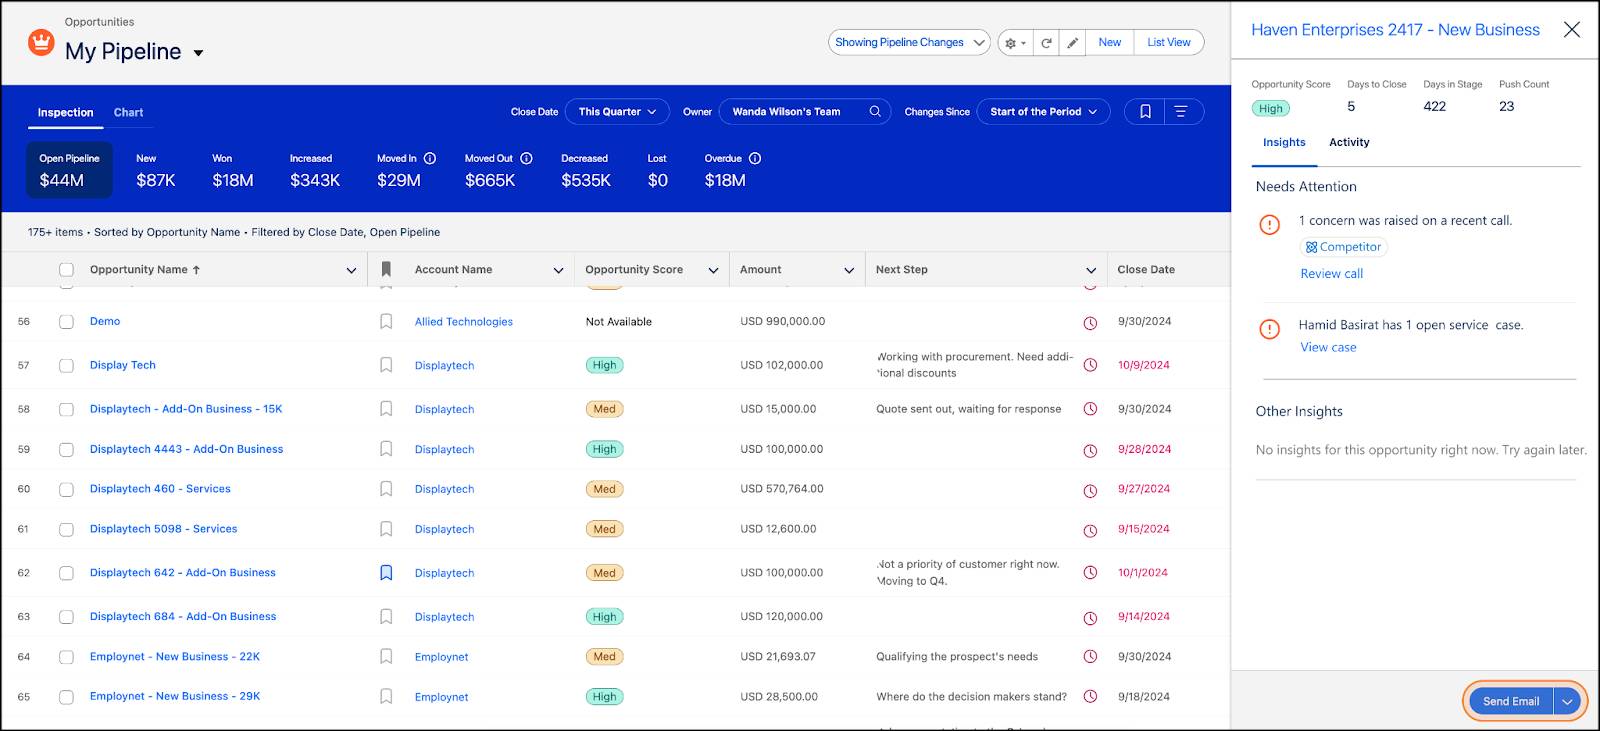
You’re familiar with the competitor, and you have a few secret weapons that have helped you win against this competitor. So, things are looking up. You use the Send Email feature to contact the sales rep and let them know that you can help with a strategy to win against this competitor.
Pretty quickly, you get an email back from the rep saying they are excited to address the competitive situation. Since this was the main risk in their deal, with a good plan they feel confident enough to commit this deal for the quarter. Looking at the pipeline, you can see that your sales rep has updated Haven and moved it to Commit. You need to adjust the forecast later to reflect this change.

Other Ways to Slice the Pipeline
Before heading to the forecasts page to adjust your forecast, you take a moment to review your team’s pipeline for the quarter. This view offers multiple ways to analyze your pipeline in depth. For instance, (1) you can click key pipeline metrics like Overdue or Increased to see related opportunities. Quick filters (2) allow you to refine the view by close date, owner, and recent changes. In the Filter panel (3), you can add more criteria, such as account, amount, and stage, while applying filter logic for a more focused view.

By carefully reviewing your pipeline, you uncover new insights to help your sales team focus on the right opportunities and boost their performance in upcoming meetings. And then you move to the Flow chart to see a visualization of pipeline movement up to the present.

Your team had a strong performance last quarter, and the pipeline has seen significant growth since then. With this in mind, you can make adjustments to the forecast and feel confident heading into forecast reviews with leadership and pipeline reviews with your team. This growth might even give you the chance to consider adjusting their quotas for the next quarter.
Resources
- Video: Ensuring Sales Rep Accountability with Pipeline Inspection
- Salesforce Help: Drive Predictable Revenue with Pipeline Inspection