Learning Objectives
After completing this unit, you’ll be able to:
- Update mark labels to ensure appropriate colors in your viz.
- Format numbers for straightforward communication.
- Configure Tooltips to communicate details.
Check: Connect Your Tableau Public Account
If you haven’t already, or if the playground has timed out, log into your Tableau Public account in the Playground window to the right. If you don’t already have a Tableau Public account, sign up for one now, and be sure to activate your account before starting this interactive unit. You can find more detailed instructions in The Tableau Data Model.

In the last unit, you used SUM(MyRating) on color and got the right result. This is because the rating is a single value for that mark, so the sum and average are the same. However…
Is it a good best practice to leave SUM for the color field as we explore the data?
Nope. If you change this viz in a way that changes the level of detail (for example, removing Episode from Detail to look at season-level trends), the SUM becomes an inaccurate aggregation. It’s safer to change it to AVG even when it's excessive, just to prevent mistakes down the line.
Futureproof Your Setup
Rather than change the aggregation again on a pill, let's change the default aggregation instead.
- Make sure you're on the Ratings Per Episode sheet.
- Drag SUM(My Rating) off the Marks card.
- Right-click the My Rating field in the Data pane and select Default Aggregation | Average. Tip: If you’re not sure what table to expand to find a field you want, try using the search bar.
- Drag My Rating from the Data pane to the Color shelf. Now every time you use that field, the pill is an average.
- But you need to reapply the purple and gold palette (because you applied it to SUM rather than AVG). Click the Color property on the Marks card.
- Click Edit Colors.
- Then, choose the Gold-Purple Diverging option from the dropdown.
- Finally, close the dialog.
Communicate Small Differences
While color is good for examining overall trends (and it looks good!), a gradient like this isn’t good at conveying small differences or for users with low vision. Let’s encode the specific ratings as mark labels.
- Drag My Rating from the Data pane to Label on the Marks card. Hmm, this is too overwhelming. Let’s format the number to only show one decimal place.
- Right click the AVG(My Rating) pill on the Marks card (either one works).
- Click Format number…
- Choose Number (Custom).
- Change the Decimal Places to 1, then click out of the formatting window.
Now you see the rating like 8.1, but the viz is still pretty busy. If you hover over a mark in the viz now, you see the default tooltip—you can keep the information there, instead. The tooltip is also a good place to put secondary information that isn't already in the viz, like Theme.
- Drag the AVG(My Rating) pill with the T icon off the Marks card. Tip: Make sure it’s the pill for the label, not color.
- Use Undo in the toolbar to go back and try again if you make a mistake.
- Use Undo in the toolbar to go back and try again if you make a mistake.
- Drag Theme from the Data pane to Tooltip on the Marks card

- Remember to use the search bar in the Data pane if you can't find a field.
- Remember to use the search bar in the Data pane if you can't find a field.
- Click the Tooltip shelf on the Marks card to bring up the Edit Tooltip dialog.
- Delete what's there to start from scratch.
- Type
Weekand add a space after it.
- Click Insert and choose Episode. This inserts the field name in angle brackets, indicating it's a dynamic value that will be filled in from the data.
- Note: Only fields used in the viz or explicitly added to the Tooltip shelf are available for inserting.
- Note: Only fields used in the viz or explicitly added to the Tooltip shelf are available for inserting.
- Type a space, then
(Seasonagain, with a trailing space.
-
Insert | Season, then type a closing parenthesis
)
- Type Enter twice to start a new line.
- For the next line, type:
-
The theme wasand add a space.
- Then, insert ATTR(Theme) with another space after that.
- Then, type
and the average rating wasand add another space.
- Then, insert AVG(My Rating).
-
- OPTIONAL: You can play around with font, color, size, and spacing to format the appearance of the tooltip.
- For example, make Week <Episode> size 14 and bold, and make both the inserted theme and ratings bold and italic.
- Tip: to format an inserted value, simply click inside the brackets and make the change, such as making the text bold.
- For example, make Week <Episode> size 14 and bold, and make both the inserted theme and ratings bold and italic.
- Click OK.
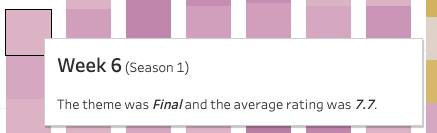
Hover over a mark in the view to see the new tooltip.
Resources
- Tableau Desktop and Web Authoring Help: Edit Default Settings for Fields
- Tableau Desktop and Web Authoring Help: Control the Appearance of Marks in the View
- Tableau Desktop and Web Authoring Help: Format Numbers and Null Values
- Tableau Desktop and Web Authoring Help: Format Titles, Captions, Tooltips, and Legends