Use a Bounding Box to Zoom In on Your Map
What’s a Bounding Box?
Now it's time to tune the awesome zip code map you created to get a better visualization. Ideally, you can zoom in on the areas for which you have data. Instead of a map that includes all of the geometry encoded in the GeoJSON, we want a map based on a subset of that geometry.
A bounding box redefines the area of the map to display by delimiting the boundaries of the new area using coordinates. The trick is figuring out the correct coordinates.
For the geographical map of zip code areas, the coordinates of every shape encoded in the GeoJSON are simply longitude and latitude coordinates. Finding the longitude and latitude of an area of the map that includes only the relevant area of the map requires a tool that can display those coordinates on the map itself.
There are many tools available on the Internet that can do this task for you. But we’ve already found the coordinates you need to zoom in on the zip codes with the data.
Create the New Map
You can create the new map from the same GeoJSON file you already uploaded.
- If you don’t already have it open, open the Los Angeles Tax Data by Zip Code dashboard and switch to edit mode.
- Select the map chart to view the widget properties.
- Expand the Map section, and then click
 next to the Map Type property.
- In the left pane of the New Map page, select custom_map_project_geojson, the GeoJSON that you previously uploaded.

- In the Map Label field, enter
Central L.A. Zipcodes.
- In the Projection Type field, select Equirectangular.
- In the center pane, drag the handles of the map to change the top, bottom, left, and right boundaries. As closely as possible, set top to 34.2, bottom to 33.85, left to -118.65, and right to -117.65.
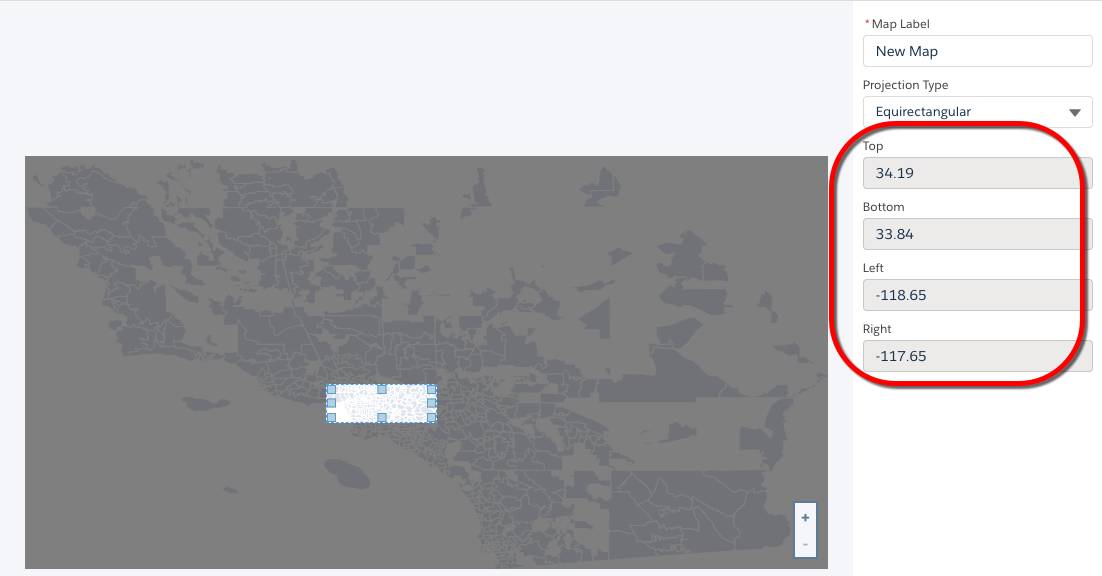
- Click Done.
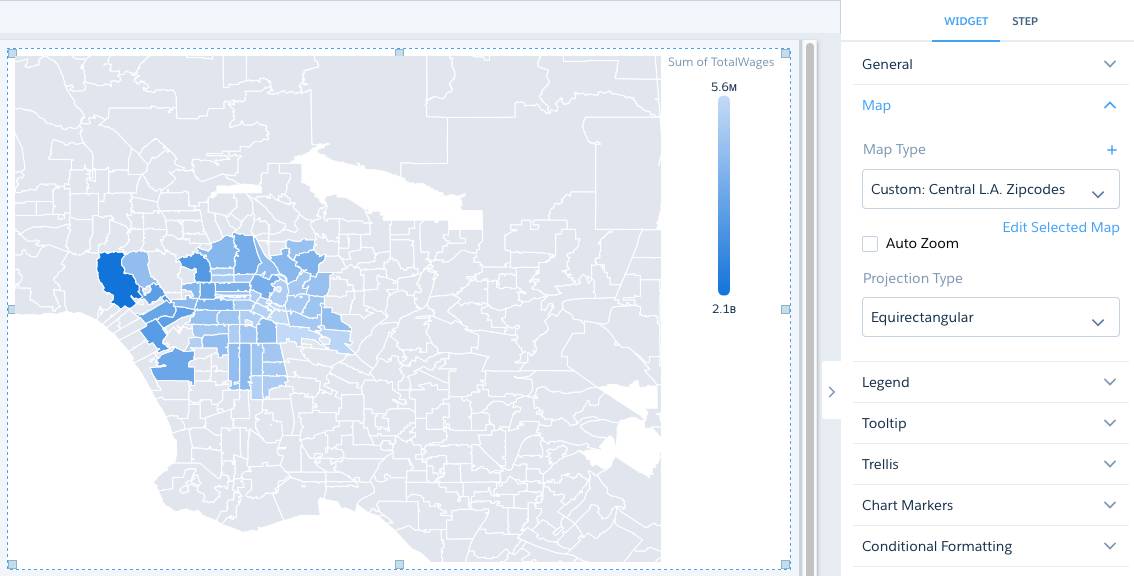
- Save the dashboard.
What a difference the bounding box makes! This useful map never existed in Analytics before you created it. With so many GeoJSON map definitions freely available on the web, there’s no limit to what geographical data you can visualize with Analytics.