Create a Threat Model
Learning Objectives
After completing this unit, you’ll be able to:
- Describe how to define security objectives.
- Create a basic data-flow diagram.
Terminology Reminder
Agreeing on Security Objectives
After you’ve assembled your threat modeling team, it’s time to decide on the security objectives of the system you’re about to analyze.
This involves three steps.
- Identify the system assets.
- Define what the attackers are after.
- Identify any security assumptions.
Start off by identifying the system’s assets. At most organizations, assets are often customer data. Assets can also include information like personally identifiable information (PII), payment card information (PCI), or other data about customers. You also have your organization's proprietary information to protect, such as production code, credentials, and trade secrets. After identifying these assets, define what attackers are specifically trying to obtain, tamper with, or destroy.
If you know the environment in which you’re building your system, list out security assumptions. For instance, if your system lives behind a firewall, list the ports that you expect to be opened or closed. Identifying assumptions gives context to your threats, simplifies analysis, and lets others potentially reuse parts of your threat model for other projects in similar environments. Remember, your team needs to reach consensus on security objectives before proceeding.
Once you’ve identified the security objectives for your project, it’s best practice to get them in writing right away. Use a shared document everyone in your team can access or another form of documentation that clearly captures your objectives.
Describe the System with a Data-Flow Diagram
After settling on security objectives, the next step of threat modeling is to describe the system in a way that makes it easy to analyze.
A data-flow diagram shows how a certain type of data flows from one part of a system to another. To create a data-flow diagram, you can use an online collaborative drawing tool like Google Drawings or Lucidchart, an offline drawing application, a dedicated threat modeling tool, or even a whiteboard with erasable markers! It’s simply important that you capture this diagram in some fashion and share a copy with your team.
A successful data-flow diagram uses consistent shapes for its components so that viewers can understand it quickly. Let’s define some of these core components.
Data Flow
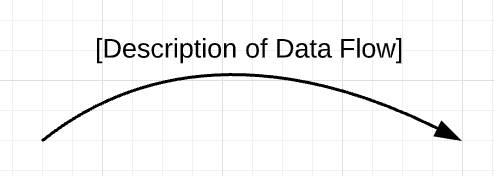
A data flow component, shaped like an arrow, shows the direction in which important data flows.
- If the same data flows in both directions, put arrows at both ends.
- You can label an arrow to help describe it, especially if what it’s connected to (a data store, for example) isn’t descriptive.
- Each arrow should show only one direction of flow. To show returning data, use a new arrow.
Entity
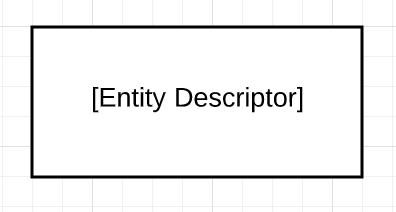
An entity, shaped as a rectangle, shows the users, actors, and related systems that data flows from (sources) or to (destinations).
- Examples of sources: Users, producers, clients, inputs, IoT sensors
- Examples of destinations: Other users, server systems, consumers, IoT output, displays
Process
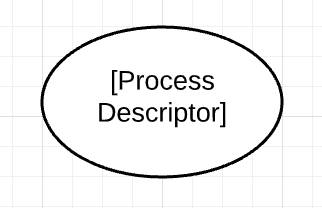
A process component, shaped like an oval, shows the conceptual processes that act on flows of data in transit—data that is actively being moved, such as across a network or the internet. Processes connect to entities, other processes, and data stores.
- You can view a process as an interaction point, where data flows across a trust boundary, a function within your project, or endpoints in an application programming interface (API).
- Processes can also be devices that “store and forward.” In networking, this concept means that data is temporarily stored at an intermediate device, such as a network switch, before delivery to its final destination.
Data Store
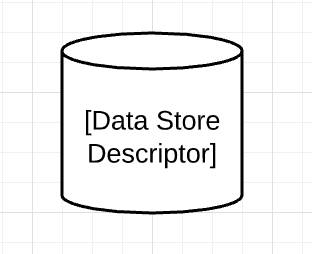
A data store component, shown as a cylinder in a data-flow diagram, is where data is stored or at rest. At rest data is typically stored in persistent storage, like a hard drive, and isn't being actively moved. In a correctly drawn diagram, data stores connect only to processes. Entities only interact with data stores through processes.
- Label these with what they store: Customer file uploads, Credentials database, Encrypted PCI, and so forth.
- Avoid labeling data stores with the name of the tech or the vendor.
- If needed for analysis, it’s okay to annotate the descriptive label with the tech or vendor name.
Trust Boundary (Zone)
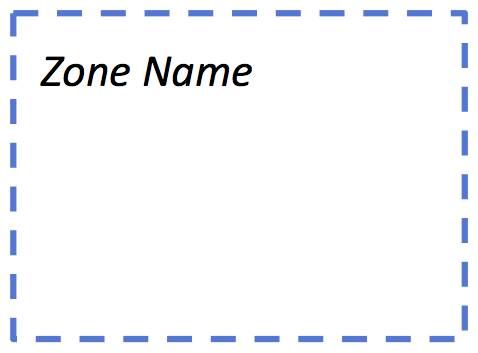
A trust boundary component shows where transitions happen between zones of differing trust (any place where data is passed between processes or where user input is accepted).
Usually, you can draw a trust boundary zone as a rectangle with a dashed border. If you are diagramming a big zone, you can draw a trust boundary as a dashed line dividing the diagram. Draw zones inside one another to indicate containment, such as a zone that can only be reached through another zone.
Here are some zone boundary examples.
Less Trusted |
More Trusted |
|---|---|
The internet |
Your intranet |
A system that runs customer code |
A system that runs your code |
Arbitrary applications |
The kernel or core of an operating system |
Here’s an example of a complete data-flow diagram. This diagram represents a blogging web server with three types of users. The numbers represent data flows where the data moves across a trust boundary. Everything outside the web server boundary is assumed to be the internet.
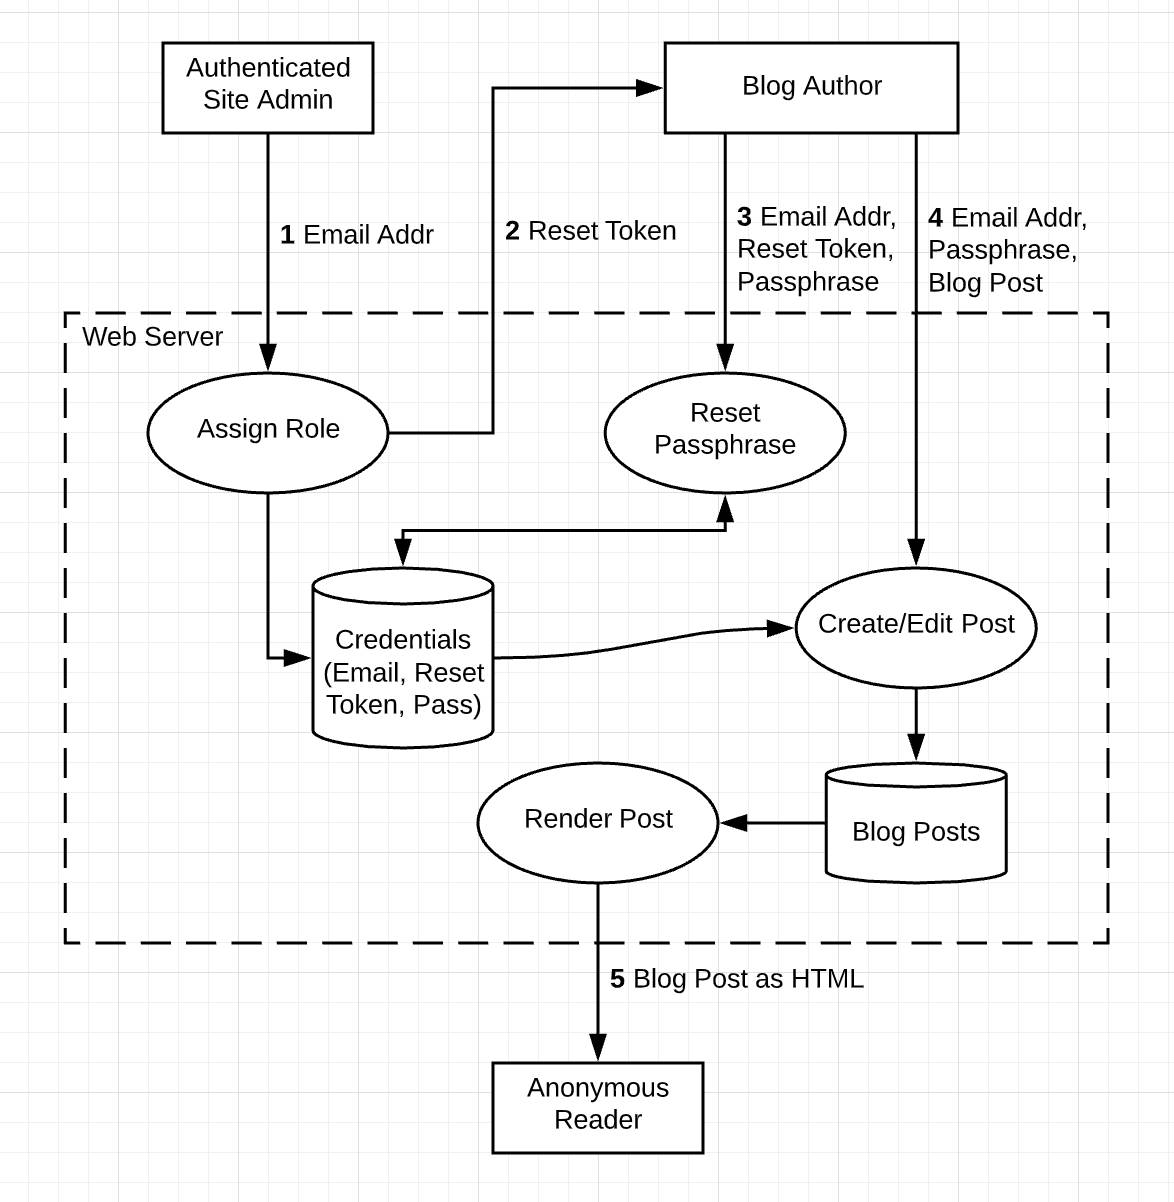
In the diagram, an administrator creates authors by entering their email addresses (1). The system then sends the authors a reset token (2) the authors can use to set their initial passphrase (3). Authors use their email and passphrase to create or edit a blog post (4). Finally, anonymous readers can see the blog post rendered as HTML (5). The entities (admin, author, and anonymous reader) exist outside of the web server trust zone.
How was the previous diagram created? You can now find out what it takes to create your own data-flow diagram.
How to Start a Data-Flow Diagram
You’ve done your preparation—you’ve assembled your team and defined your security objectives. You’re ready to draw the first shape of your data-flow diagram. But, as any artist knows, a blank canvas can be daunting. How in the world do you start?
There’s a solution! Begin with one of each of the block components: one entity, one trust boundary, one process, and one data store. Connect them together as shown in this diagram.

Now, how do you name these components? Focus first on the entity (the rectangle). Is the entity a user in a web browser? If so, label the entity as such and make the process (the oval) one of the actions the user performs. Then label the data store (the cylinder) based on how that data comes to rest. Finally, draw the trust zone (the dotted-line) as the web server that contains the process and the data store, as shown in this diagram.

Is the entity a mobile app? If so, identify the entity as such (the rectangle). Then describe the process that was performed, such as registering a device (the oval), and label the data store (the cylinder). Finally, draw the trust zone and label it as the API service that invoked the register device process.

From this seed of a diagram, you can move things around and add other components—entities, processes, and data stores—until you have a complete representation of a system. Connect the components with arrows to indicate the direction important data flows.
Writing Stories
In threat modeling, a data‑flow diagram shows how data moves through your system so you can define security objectives and identify what needs protection. Writing a brief story or outline can also help you start your data-flow diagram if you’re stuck. Here’s an example: “The admin creates an account by inputting an email address. The new account is stored in the database, and an email is sent to the new user with login instructions.” Once you have this narrative, start diagramming its key parts. This helps you create a basic diagram of your system’s backbone, and you can add more detail from there. As you diagram the narrative’s key parts, focus on where data enters, is transformed, and leaves the system—those points help you identify what to protect and why.
It’s important to be able to refer to unique elements in your data-flow diagram so you can easily identify threats. You can do this with a simple numbering system—if you want to analyze a particular entity, process, or data store, place a number near it. Because threats are frequently identified at interaction points, be sure to give these particular flows a number, too. Just don’t repeat the numbers!
Ready to Move On
How do you know when your data-flow diagram is complete? The following questions are a good start.
- Did you label all processes and entities?
- Is the overall representation of the system accurate?
- Did you include all trust boundaries?
- Does all data in the diagram eventually flow both from and to one or more entities?
- Do any flows go “nowhere” or outside of your project? If so, note the other scope or system as an entity.
- Have you added arrows to the data flows?
- Have you numbered interaction points?
- Can someone use this diagram to identify what needs protection?
- Are potential risk points clearly marked and numbered for reference?
With data-flow diagrams, you can accurately define your organization’s security objectives and identify what you are trying to protect. In the next unit, we’ll discuss who and what you might be protecting your organization from.
Resources
