Format Interactive Elements
Learning Objectives
After completing this unit, you’ll be able to:
- Format interactive controls.
- Format marks.
- Format tooltips.
- Format animations.
Format Interactive Controls
You can format all of your interactive controls—including legends, filters, highlighters, and parameters—at the same time using the Interactive Controls section of the worksheet format pane.
To access these settings, go to Format, then select Worksheet and Interactive Controls.

If you'd like these controls to have consistent formatting, formatting at this level saves you time. If you want your Interactive Controls to have a different look, you can format legends, filters, highlighters, or parameters on their own.
There are several ways to format the Interactive Controls individually. When you click the legend card itself, the formatting pane updates with the options for that specific control. You can also click the menu on the control card to access formatting options or click Format on the toolbar and choose the control (Legends, Filters, Highlighters, or Parameters) from the list.
Format Marks
When you drag fields from your data source onto the Marks card, you add visual detail to your data with size, shape, text, color, and other properties that can add meaning to the data points on your viz. You can assign colors to marks, show and hide the mark labels, change the size of the marks, and even change the shape or type of marks displayed on your view.
The formatting options for Marks are on the Marks card.
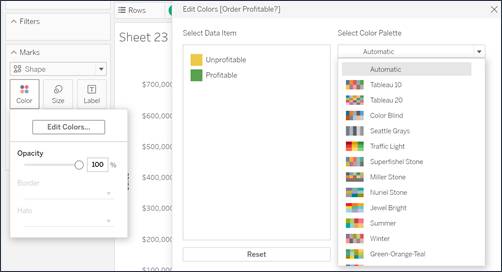
Edit Colors
Here’s how to change the color palette or customize how color is applied to your marks.
- On the Marks card, select Color then Edit Colors.

- Select the Color Palette you'd like to use.
- Select the Data Item you'd like to change.
- Choose a color for the data item from the menu.
In this example, the palette is set to Traffic Light and the color red is assigned to the Unprofitable data item.

Edit Size
To change the size of marks, on the Marks card, click Size, and then move the slider to the left or right.
Edit Shape
Here’s how to change the shapes of marks.
- In the Mark type dropdown menu, select Shape.
- From the Data pane, drag a field to Shape on the Marks card.
- Click the Shape box, and choose a shape.

Format Tooltips
Tooltips are details that appear when you hover over one or more data points, or marks, in your view. Like most other interactive elements, you can format them to look the way you want them to. You can customize the font type, size, and color. You can also choose if you'd like your font to be centered, aligned left, or aligned right.
- On the Marks card, select Tooltip.
- Highlight the text you'd like to format.
- Use the formatting tools along the top of the Edit Tooltip dialog box.
- Make your selections and click OK.

To reset your custom formatting, click Clear Formatting.
Format Animations
When you create a workbook, Tableau enables animations for your viz by default. You can turn animations on or off at the workbook or the worksheet level.
- Go to Format and select Animations.
- Decide if you want your formatting to apply to all sheets within a workbook or just an individual worksheet.
- If you want to animate every sheet, under Workbook Default, click On.
- If you want to animate an individual sheet, make sure that the sheet you want to animate is shown under Selected Sheet.
- Then choose from these options:
- Duration: You can choose a preset time duration or specify a custom duration of up to 10 seconds.
- Style: You can choose Simultaneous, which will play all animations at once; or Sequential, which will fade out marks, move and sort them, and then fade them in.

To reset your animation formatting, click Reset All Sheets, located in the middle of the Format Animations menu. Note that this will reset the animation formatting for all sheets in the workbook.
Tableau provides you with the tools to take your viz from good to great. As you learned, you can customize almost every element of your viz so that you can tell your story the way that's the most meaningful for your analysis and presentation.
