Manage and Optimize Your Tableau Cloud Environment
Learning Objectives
After completing this unit, you’ll be able to:
- Describe how to monitor Tableau Cloud availability, performance, and security.
- Explain how Tableau Cloud upgrades and maintenance schedules work.
- Define what Admin Insights is.
- List four data governance best practices for Tableau Cloud.
Introduction
Congratulations! You’re on your way to shedding the responsibility for server upgrades and maintenance, scaling your deployment, and mitigating potential server downtime and performance issues.
Though your Tableau Server journey is wrapping up, your Tableau Cloud journey is just beginning. In this unit, you learn postmigration best practices to ensure you get the most value out of Tableau Cloud.
Maintenance and Monitoring
At Salesforce, our #1 value is Trust, and that means we keep you in the know. We encourage all Tableau Cloud users to subscribe to updates from Salesforce Trust, the Salesforce site for details on service availability, performance, security, privacy, and compliance. Here, you can see the status of each Tableau Cloud pod, and any reported issues.
-
How do I know which instance (pod) I am on? Your pod is shown in the first portion of the site URL after signing in to Tableau Cloud. For example, if the first portion of the site URL is https://10ay.online.tableau.com, your pod name is 10AY.
-
What does each availability status represent? The color indications on the Status tab on the Salesforce Trust site show you the availability status of each instance.
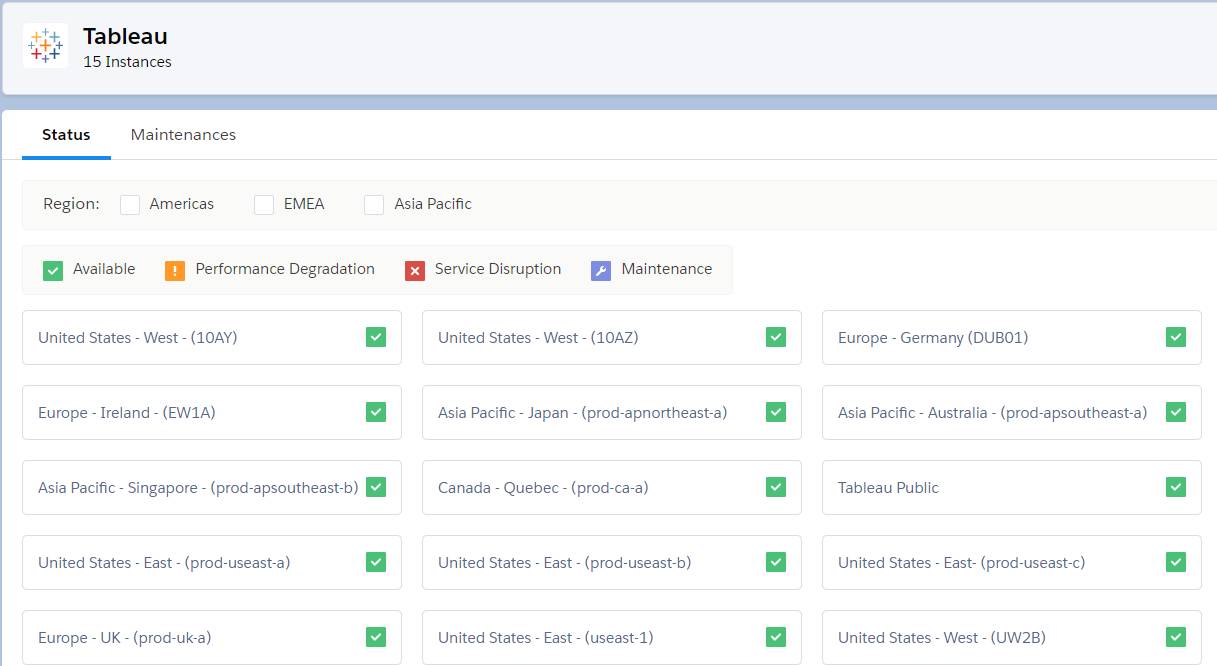
- Green (Available): This instance is available and fully functional.
- Purple (Maintenance): This instance is currently in maintenance. A message is provided regarding your ability to access the instance during maintenance.
- Orange (Performance Degradation): The instance is still accessible, but some functionality can be unavailable or the service can be running with significant latency.
- Red (Service Disruption): The instance is inaccessible.
Our Upgrade and Maintenance Schedule
To ensure that Tableau Cloud performs optimally and securely, we perform periodic maintenance to sustain the infrastructure that supports Tableau Cloud services and to deliver enhanced features and functionality. As a Tableau Cloud site administrator, you don’t have to worry about managing updates to your site. But we recommend that you review the reserved maintenance schedule to plan for scheduled downtime and to avoid service interruptions.
There are two types of maintenance.
-
Version upgrades (no downtime): We roll out major releases across Tableau Cloud’s worldwide infrastructure over several weeks, before upgrading our on-premises software. Because we roll out our releases approximately every 4 months and in sequence worldwide, we do not preannounce exact dates and times. Instead, we use in-product notifications to inform users and administrators of upcoming releases. You’ll see an in-product notification approximately 2 weeks before the scheduled upgrade of your exact site and pod. For more information, refer to the Tableau cadence schedule for more information.

-
Reserve system maintenance schedule (potentially requires minor downtime/outages): Salesforce and Tableau periodically do system maintenance on Tableau Cloud for sustaining the security, availability, and performance of the infrastructure supporting Tableau Cloud services. We communicate these reserve maintenance schedules well in advance to help you plan for any scheduled downtime and avoid service interruptions to your Tableau Cloud site.
Information About Your Site/Pod/Instance Maintenance
Instance maintenance information is located on the instance detail page. You can get to the instance detail page by clicking the instance name on the System Status page.
The following components exist outside of Tableau Cloud and therefore are not part of the automatic upgrades.
- Tableau Desktop
- Tableau Prep Builder
- Tableau Bridge
To keep these components up to date and maintain compatibility with Tableau Cloud, we recommend that you establish an upgrade cadence. See Tableau Release Cadence to learn how each product is updated.
Keep Up with New Features
The regular Tableau Cloud maintenance schedule means that alluring new capabilities are always on the horizon. To keep up to date with new features on your site, see Coming Soon. The Coming Soon page offers information about upcoming and in-progress Tableau releases.
Monitor Your Tableau Cloud Environment
Admin Insights is a Tableau Cloud-only project that is prepopulated with curated data sources and prebuilt dashboards displaying your site’s metadata. If you’re familiar with the Tableau Server repository, Admin Insights is your new best friend as a site admin. You can monitor site activity, health, stale data, and much more. If the prebuilt dashboards don’t suffice, you can create your own custom views using the following extracted data sources.
- TS Events
- TS Users
- Groups
- Site Content
- Viz Load Times
- Job Performance
- Permissions
- Subscriptions
- Tokens
If you have Tableau Cloud Enterprise or Tableau+, you can configure the Activity Log to send log events to Amazon Simple Storage Service (S3) for further analysis and auditing. It can take up to 15 minutes for events to appear in your S3 bucket after they occur. This is useful for compliance and more timely notifications for change monitoring.
The most up-to-date option for notifications within a site is a Tableau Webhook. Webhooks are a common method whereby one computer system can notify another that an event has occurred using standard web technologies such as HTTP and JSON. With Tableau Webhooks, you can automatically trigger these workflows. When events happen in Tableau, a notification can be sent wherever you want, triggering a workflow. Here are some examples of what you can do with Webhooks.
- When an extract refresh fails, file a ticket in ServiceNow automatically.
- When a workbook is updated, notify your team via their Slack channel.
- When a data source is published, email a data steward asking them to review and certify it.
- When a workbook refresh completes successfully, generate a PDF and post it to SharePoint.
Site admins can create and manage Webhooks within a site using the Webhooks REST API. Work with your admin to set up the endpoint that receives the notification.
Governance Best Practices
Tableau Governance is a crucial aspect of self-service analytics, enabling trust and confidence in data and analytics within an organization. It provides guidelines and structure to protect data and content while allowing permissions and access for a successful self-service environment. Governance in Tableau involves collaboration between IT and business stakeholders to define data and content governance. This collaborative approach ensures that business users become self-reliant within a trusted environment, participating in maintaining data quality. Implementing a clearly defined governance framework is essential for any data-driven company.
To guarantee data security, use user filters and virtual connections with data policies for row-level security, enabling personalized data access for users based on their roles and responsibilities. Implement a data quality warning system to inform users of potential data issues, fostering trust and transparency in the data.
Help users find the data they need: To enhance data discoverability and minimize duplication, encourage authors to use Tableau Catalog to search for existing data sources, databases, and tables before creating new ones.
Implement a content promotion process: Establish a workflow for promoting validated content to a trusted project location. You can use the Content Migration Tool, REST APIs, or tabcmd to seamlessly migrate content between projects. Encourage an agile approach to content promotion, balancing control with flexibility to meet business needs.
Certify data sources: To improve data discoverability, enable data stewards to certify trusted data sources. Formalize content certification procedures and designate roles responsible for certifying content. Clearly communicate certification criteria to content authors and the location of certified content to consumers.
Monitor content and understand usage: Encourage site administrators (and project leaders) to use prebuilt and custom administrative views for tracking content usage patterns and identifying stale content. Communicate content utilization metrics to content authors to foster a data-driven approach to content creation and improvement.
Wrap It Up
You’re now equipped with the best practices for a successful Tableau Cloud deployment! With automatic upgrades, you can step away from maintenance and focus on using the latest features. Built-in monitoring tools like Admin Insights and Activity Log provide valuable insights into user behavior, with the flexibility to customize as needed. A strong collaboration between IT, data stewards, content authors, and business users ensures effective governance and a seamless transition. By following these best practices, your organization can fully optimize Tableau Cloud and take advantage of its full potential.