Tableau Data Analyst for Winter ’26
Learning Objectives
After completing this unit, you’ll be able to:
- Use custom themes to keep your workbooks and dashboards looking consistent.
- Set up dynamic color ranges so outliers don’t throw off your color scales.
- Use dynamic spatial parameters to sync map views and adjust calculations on the fly.
- Build data prep flows in Tableau Prep with help from Tableau Agent to speed up ETL work.
- Use Tableau’s relatedness tooltips to understand field connections and fix multi-fact relationship issues in your data.
- Apply logical table filters to limit filters to just one table—no custom SQL needed.
- Use Bridge in Tableau Prep Cloud to connect to local data sources without extra steps.
Learn About Custom Themes
Custom themes let you create a consistent visual style across multiple workbooks—or even a whole organiztion—ensuring that formatting, fonts, colors, and shading adhere to your company’s standards. By defining a custom theme, you can save time previously spent applying manual formatting and reduce the risk of inconsistencies across reports.
This is particularly useful in organizations with multiple contributors, as it ensures all dashboards maintain a professional and cohesive appearance. For example, a financial institution might use a custom theme to ensure all dashboards reflect the company’s brand colors, font styles, and layout conventions. Implementing custom themes also supports accessibility and readability by standardizing visual elements across visualizations.
At the moment, this feature is only available on Tableau Desktop, where analysts can import a theme via Format > Import Custom Theme… and export a theme via Format > Export Custom Theme… using the required JSON files.
Explore Dynamic Color Ranges
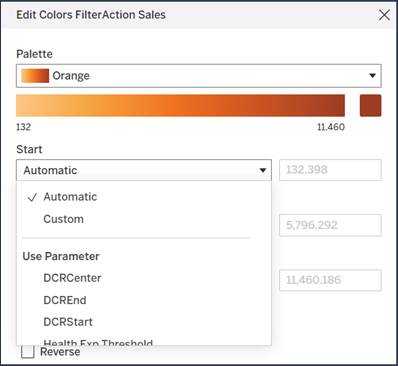
Dynamic color ranges give you greater control over how color legends behave when visualizations are filtered or drilled down. By using parameter actions, you can adjust the minimum and maximum values for the color legend, preventing outliers from skewing visualizations and ensuring that the full range of relevant data is represented clearly.
This is especially valuable when dashboards include multiple charts that need to share a consistent color scheme or when data includes extreme values that might otherwise distort the visual interpretation. For instance, a sales dashboard might use dynamic color ranges to ensure that a single outlier does not make all other data points appear insignificant. Proper use of dynamic color ranges helps maintain clarity, ensures interpretability, and provides a more accurate representation of the underlying data trends.
Use Dynamic Spatial Parameters
Dynamic spatial parameters let you create interactive map-based dashboards where the map viewport or zoom level is controlled by user input or selections in other charts. This allows input data to be used to control spatial calculations, like setting a map viewport or zoom defined by the data selection in another chart, or keeping multiple maps in sync.
These parameters enable multiple maps to remain synchronized or adjust dynamically based on a selected data subset, making geospatial analysis more intuitive. For example, selecting a region in a summary table could automatically zoom all related maps to that region, highlighting patterns or trends without requiring manual navigation.
Dynamic spatial parameters enhance the usability of geospatial dashboards, making it easier for users to explore spatial relationships and uncover insights. They are particularly valuable in scenarios such as regional sales performance analysis, logistics optimization, or demographic studies.
Create Prep Flow Using Tableau Agent
Tableau Agent in Tableau Prep is getting even more powerful. Previously, Tableau Agent could help you create calculated fields as you built your flow. Now, it can help you clean your data, build your flow, and still assist with calculated fields—making the entire data preparation process faster and easier.
To use Tableau Agent, describe what you want to do in plain language. For example, you might type, “Split the Flight Details field into separate fields for flight, date, class, and price,” or “Change the Order Date field values to month.” Tableau Agent responds with a summary of how it plans to complete your request, along with a set of suggested steps. You can apply these steps one by one, or apply them all at once to build out your flow.
You can review every step Tableau Agent suggests, make changes if needed, and even edit calculations manually. And if you want to adjust anything later, you can simply use Undo or Redo to refine the flow.
To use Tableau Agent in Tableau Prep, you’ll need a Tableau+ license edition and a connection to a Salesforce platform with Einstein generative AI enabled. If you’re using Tableau Prep Builder, you must sign in to a Tableau Cloud site with Tableau+ and ensure Tableau Agent is turned on. If you don’t have Tableau+, you can sign up for a Tableau Cloud free trial, which now includes Tableau Agent features.
This update showcases how Tableau uses AI to make data preparation easier, faster, and more accessible. By turning natural language into actionable steps, Tableau Agent helps creators spend less time wrangling data and more time finding insights.
Designed for trust and security, Tableau Agent operates on the Einstein Trust Layer, ensuring that your data and interactions are never stored or used to train the AI. The feature requires an active internet connection and a Tableau Cloud site with Tableau+ and AI in Tableau enabled. It works best with extract or file-based data (.hyper, .csv, .txt, .xlsx) and is not yet available for dashboards, stories, or cubes.
To launch Tableau Agent, click the Agent icon in the toolbar or in the calculation editor, connect to your data source, and start asking questions. This AI-powered assistant accelerates analysis, helps you uncover insights faster, and guides you in choosing the right visualizations—all while keeping your data secure.
Learn Tooltips in Multi-Fact Data Models
When working with data models that include multiple base tables, Tableau needs to evaluate how fields relate to each other to produce accurate results. This is where field relatedness and tooltips come into play.
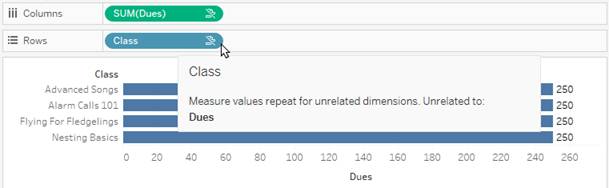
At a high level, Tableau checks which fields are active in your view (the fields you’ve placed on shelves) and determines how they relate. If a field is unrelated to others in the view, Tableau shows an unrelated icon next to it—either in the view or the Data pane. Hover over the icon to see a tooltip explaining how that field affects the visualization.
Tooltips vary depending on where the field appears:
-
On a shelf: The tooltip explains how fields relate and what impact that has on your results.
-
In the Data pane: The tooltip shows what would happen if you added that field to the view. Unrelated fields may appear grayed out to signal that they aren’t currently connected to the active fields.
This matters because when dimensions are unrelated, Tableau uses a cross join, which can create combinations of values that don’t exist in the real data and can impact performance. To improve accuracy, you can use stitching dimensions (shared fields that connect tables) to change the join type to an outer join, which limits results to relevant combinations and avoids performance issues.
You can also see tooltips for:
-
Unrelated dimensions and measures: Tableau shows repeated values because the measure can’t be broken down by unrelated dimensions.
-
Not yet related fields: Fields that have a potential relationship but haven’t been connected yet.
-
Ambiguously related fields: Fields that have multiple possible relationships and are treated as unrelated until the ambiguity is resolved.
-
Unrelated filters: Filters that don’t impact certain fields in the viz.
For the clearest analysis, regularly check your data model (Worksheet | View Data Model) to understand how your tables connect. Look out for relatedness icons and use stitching dimensions where needed to avoid unexpected results.
In short, relatedness tooltips are your guide to understanding how Tableau interprets your multi-table data model—and to ensuring your visualizations accurately reflect your data.
Explore Data Source Filters
Data source filters let you control what data users can access before they start analyzing. When you publish a data source to Tableau Cloud or Tableau Server, these filters are applied automatically—users see only the filtered data, but can’t view or change the filters themselves. This makes them ideal for enforcing data security, improving performance, and providing curated subsets of data, such as filtering by region, user group, or date range.
You can scope filters in two ways: a pervasive filter, which applies to a table and all related tables; or a per-table filter, which applies only to a single logical table. New in this release, you can now limit a data source filter to a single table without using custom SQL, so it won’t affect other connected tables in the data source. Extract filters work similarly but control what data is brought into an extract. In multi-table data models, extract filters act as per-table filters by default.
To create a data source filter, add it from the Data Source page or by right-clicking the data source in the Data Pane. Choose the field you want to filter, specify the criteria, and set the scope. Some filters, such as those based on calculated fields referencing multiple tables, must still apply pervasively across all related tables.
You can also promote global filters from a workbook to data source filters in Tableau Desktop, ensuring they apply consistently for anyone using that data source. This feature helps ensure data security, improves performance, and provides users with relevant, curated data subsets without affecting other tables or users’ analyses.
Bridge Connectivity in Tableau Prep Cloud
Tableau Prep users in Tableau Cloud often need to connect to on-premises data behind a VPN or firewall. Without this capability, preparing cloud-based data can be limited, which slows adoption of Tableau Prep in the cloud.
With Tableau Bridge, users can natively connect to on-premises data directly from Prep. This allows them to create and transform flows using secure internal data without leaving their network environment. Once flows are built, they can be refreshed automatically using Tableau Prep Conductor, ensuring outputs remain up to date.
This functionality empowers citizen data prep users to work efficiently with on-premises data, reduces barriers to adopting Tableau Cloud, and increases overall Prep usage. By enabling seamless access to internal data, Bridge connectivity supports a smoother migration of workflows to the cloud while maintaining security and compliance.
Summary
By getting to know these features, you can create more consistent, interactive, and trustworthy analytics experiences in Tableau. Custom themes and dynamic color ranges help maintain visual clarity and brand consistency, while dynamic spatial parameters and Tableau Agent streamline exploration and data preparation.
Understanding tooltips in multi-fact data models ensures your analyses remain accurate, and data source filters keep information secure and performant. Together, these capabilities empower you to deliver insights that are clear, actionable, and aligned with organizational needs.
Resources
- Tableau Help: Use Custom Formatting Themes
- Tableau Help: Dynamic Color Ranges
- Tableau Help: Spatial Parameters and Operators
- Tableau Help: Build Tableau Prep Flows with Tableau Agent
- Tableau Help: Understand Tooltips for Multi-Fact Relationship Data Models
- Tableau Help: Filter Data from Data Sources
- Tableau Help: Publish a Flow to Tableau Server or Tableau Cloud
- Tableau Desktop and Web Authoring Help: Embed Metrics into Webpages (Retired)
- Tableau Desktop and Web Authoring Help: Create a Tableau Data Story (Retired)