Build a Report
Learning Objectives
After completing this unit, you’ll be able to:
- Create a custom table report.
- Filter data in a custom table report.
- Add, remove, and order columns in a custom table report.
- Explain why blank values appear in columns.
- Add currency information to custom table reports.
Create a Report
In Spiff, a custom table report helps you present data that highlights key metrics and insights relevant to your team. It provides a clear and concise view of the data, helping your team focus on the most important information.
The first step to getting there is creating a report. Here’s how.
In this module, we assume you're a Spiff administrator with the proper permissions to manage reports. If you’re not an administrator for Spiff, that’s OK. Read along to learn how your administrator would take the steps in a production org. Don't try to follow these steps in your Trailhead Playground. Spiff isn't available on the Trailhead Playground.
- In the Spiff navigation, click Reporting and then select Reports.
- Click + Create Report.
- Add a name and description for your report. A name is required for each report, but they aren’t required to be unique.
- In Choose Report Type, select either Obligation report or Statement report.
- Save your work.
Your new report is ready. It’s time to customize it according to your business requirements.

Filter Data
Your default report is filtered to the current statement period. You can change this value and further filter your report to include only data about plans, teams, and reps you want to include. Obligation reports also give you the option to filter by payout rules. The filters in the screenshot here are for an obligation report.
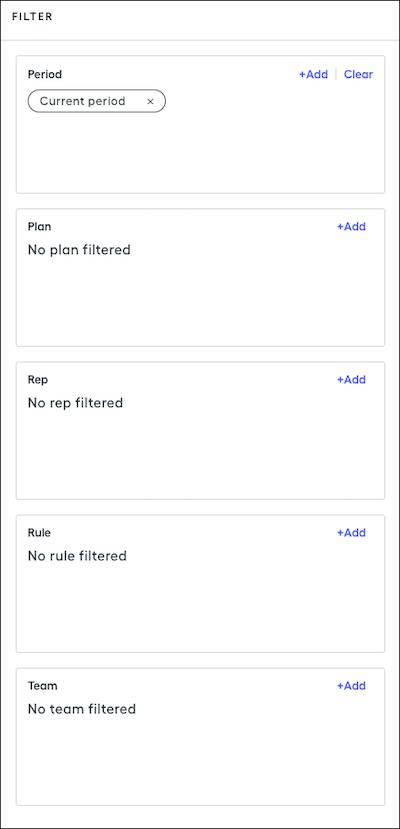
For the period filter, you can include a range of periods or just a single period. Select multiple months by clicking several values in the single-period picklist, then click Apply. In addition to static periods or ranges, the Dynamic tab gives you the option of three date ranges: current period, last period, and year to date.
If you don’t specify a filter for a plan, rep, rule, or team, the custom report includes data from all of the plans, reps, rules, and teams for that period.
Click  to hide the filter panel.
To run a report, click Run & Save. For the new data to appear, save the report. Each time you edit, save, and run a report it overwrites the previous settings, so be careful with reports used by others.
Assuming there’s data for the specified period, plan, team, and so on, you see it populated in the datasheet.
Add, Remove, and Order Columns
Depending on the type of report you choose, you see different default columns. To change columns, click  next to Run & Save.
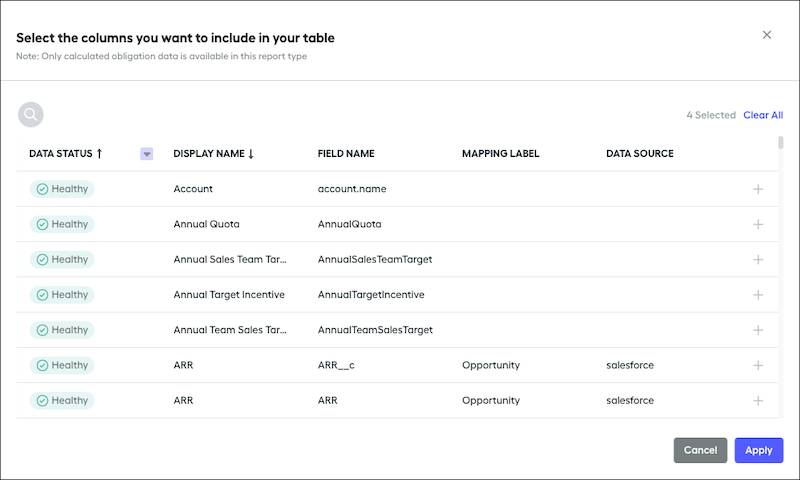
In the window that appears, explore the list of calculations, connector fields, and Spiff system fields that can be added to the report. Depending on how many calculations have been created in Spiff Designer and the number of fields synced from your data sources, this list can be long. Click  and enter a column name to quickly find specific data. You can also sort by any of the column headers in the selection window. An additional Data Source column is available in the Obligation report selector, which you can see in the screenshot here.
To add a field to the report, click  on that row. To remove an added field from a row, click
  .
.
If you hover over the values in Data Status, you can read a short description of what each label means. Fields sorted by data status list the Healthy status at the top.
When you finish making changes, click Apply. Your new columns appear in the table. To view the data in those columns, click Run & Save.
To reorder your columns, click and drag them to the order you prefer. You can also reorder them using the Columns menu accessible in the report—you learn more about that menu in the next unit.
Understanding Blank Values in Columns
Imagine you want to include a field from a rep statement on an Obligation report. You add it to your report, but after you run it there are many blank values appearing in the column. Why? The data status field said that this data was healthy!
Spiff returns these missing values because the field is only used in one particular rule, and not the other rules you selected in your report. Obligations for another rule are blank because that rule doesn’t use the calculation.
So, while it seems like an error, the report ran correctly. To avoid blank fields in a rule, use those fields in rule calculations or make them visible on the rep statement for the corresponding obligations. The same is true for all the calculations or connector fields on a report or on a rep statement.
Include Currency Information in a Report
When you add any currency metric or column such as Deal Amount or Total Sales to a report, it isn’t automatically displayed with the currency code. This is critical information to include.
Here are some details about how to display currency codes in your custom table report.
Include the Currency Code for the Commission Amount Column
Statement reports and Obligation reports both include the default Commission Amount column. For Statement reports, this column represents the total commission amount for the statement. For Obligation reports, this column represents the commission amount calculated either line by line or as one value for lump-sum rules.
To view the currency code for the commission amount, add the Currency Code column.
- On the report, click
 .
.
- Find and select the Currency Code field.
- Click Apply.
- Click Run & Save.
The column appears with the currency code corresponding to each commission amount.
Include Currency Codes for Other Fields, Columns, and Measures
You likely want to know the currency of other fields added to a report, such as Deal Amount or YTD Sales. As with Commission Amount, the related currency code for these fields doesn’t appear in the report by default.
As long as any field is a Currency data type, it includes the currency code in an exported report. The data type is either synced or set up in Spiff Designer.
Export the report by clicking  .
.
When you open the file, a Currency Code column appears for each currency field.
In this unit, you learned how to create a report, filter the data, and customize the columns. There’s so much more you can do with your custom table report, though. In the next unit, you learn how to sort, filter, and group data. Plus, you learn about other helpful tasks, such as improving report performance with Preview Data mode.