Deploy Analytics for Loyalty
Learning Objectives
After completing this unit, you’ll be able to:
- Create and share an app from the Analytics for Loyalty template.
- Embed dashboards in the page layout.
- Schedule data import frequency.
Create and Share an App from the Template
The Analytics for Loyalty app provides useful prebuilt dashboards that offer a visual summary of the loyalty data. Jenny is eager to get these dashboards ready for the loyalty team so they can strategize how to increase membership, retain customers, improve processes, and grow the business.
Let’s follow Jenny as she creates and shares the app.
Create the App
Jenny navigates to Analytics Studio, the tool for building analytics assets, and creates the app from the Analytics for Loyalty template.
- Click
 , and select Analytics Studio.
- Click Create, then select App.

- Select Analytics for Loyalty, and click Continue.
- Take a quick look at the preview page for an overview of the available dashboards and other details. Click Continue.

- Analytics performs a compatibility check of the org data. If it completes the check successfully, click Looks good, next. If it uncovers any issues, you see error messages with instructions about how to address them. Fix the issues and try app creation again.
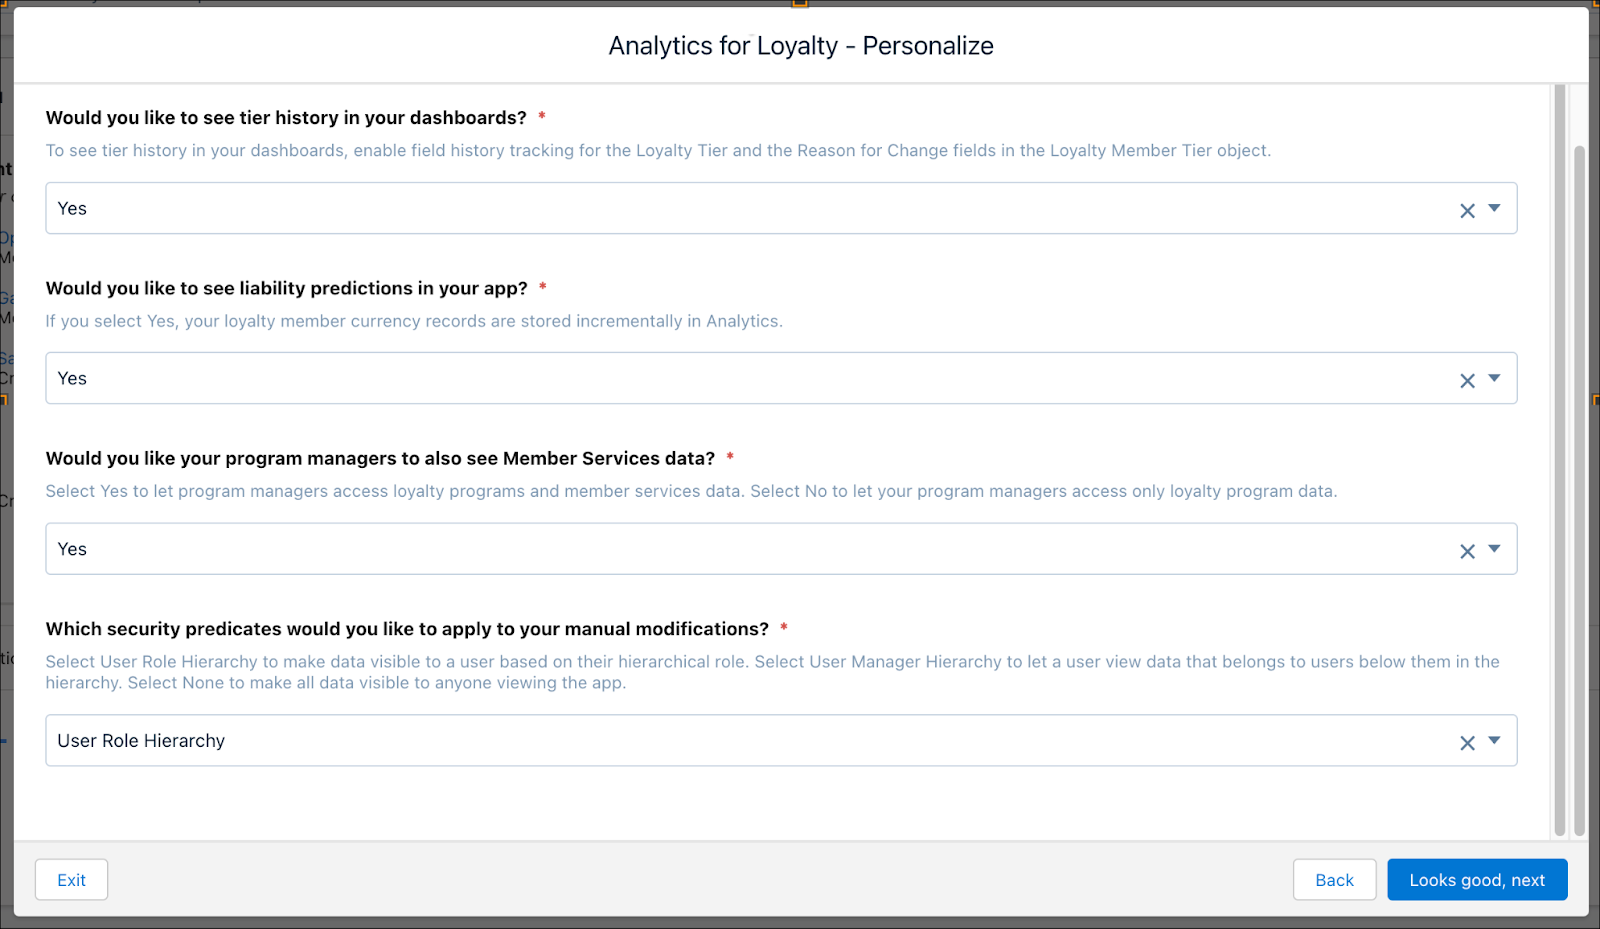
- The next page of the wizard asks you four questions to help you personalize the app based on business requirements. Here’s what Jenny selects.
- The first question asks if you want to see tier history data in your dashboards. To see it, enable field history tracking for the Loyalty Tier and the Reason for Change fields in the Loyalty Member Tier object. Select Yes.
- The second question asks if you want the liability predictions to be seen in your app. Select Yes.
- The third question asks if you want your program managers to also see the Member Services data. Jenny thinks it’s good for Linda to access loyalty programs and member services data. Select Yes.
- The last question asks which security predicates to apply to manual modifications. User Role Hierarchy makes data visible to a user based on their hierarchical role, User Manager Hierarchy lets a user view data that belongs to users below them in the hierarchy, and None makes all data visible to anyone viewing the app. Select User Role Hierarchy.
- Click Looks good, next.
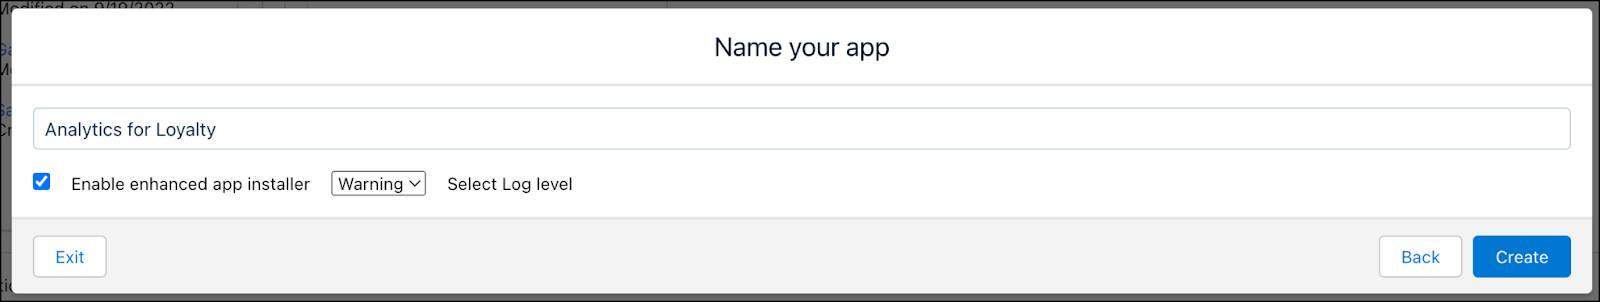
- Enter app name:
Analytics for Loyalty - Click Create.
Jenny views the app creation status on the next screen. The process takes a few minutes. After it’s complete, she clicks Open to view the app.

Jenny sees the list of dashboards and datasets created in the app.

Share the App
Jenny can share the app only with users assigned the admin or user permission sets for Analytics for Loyalty. And she can configure the access level for each user: viewer, editor, or manager. Here’s how she shares the app and configures access to it.
- In the Analytics for Loyalty app, find and click
 .
.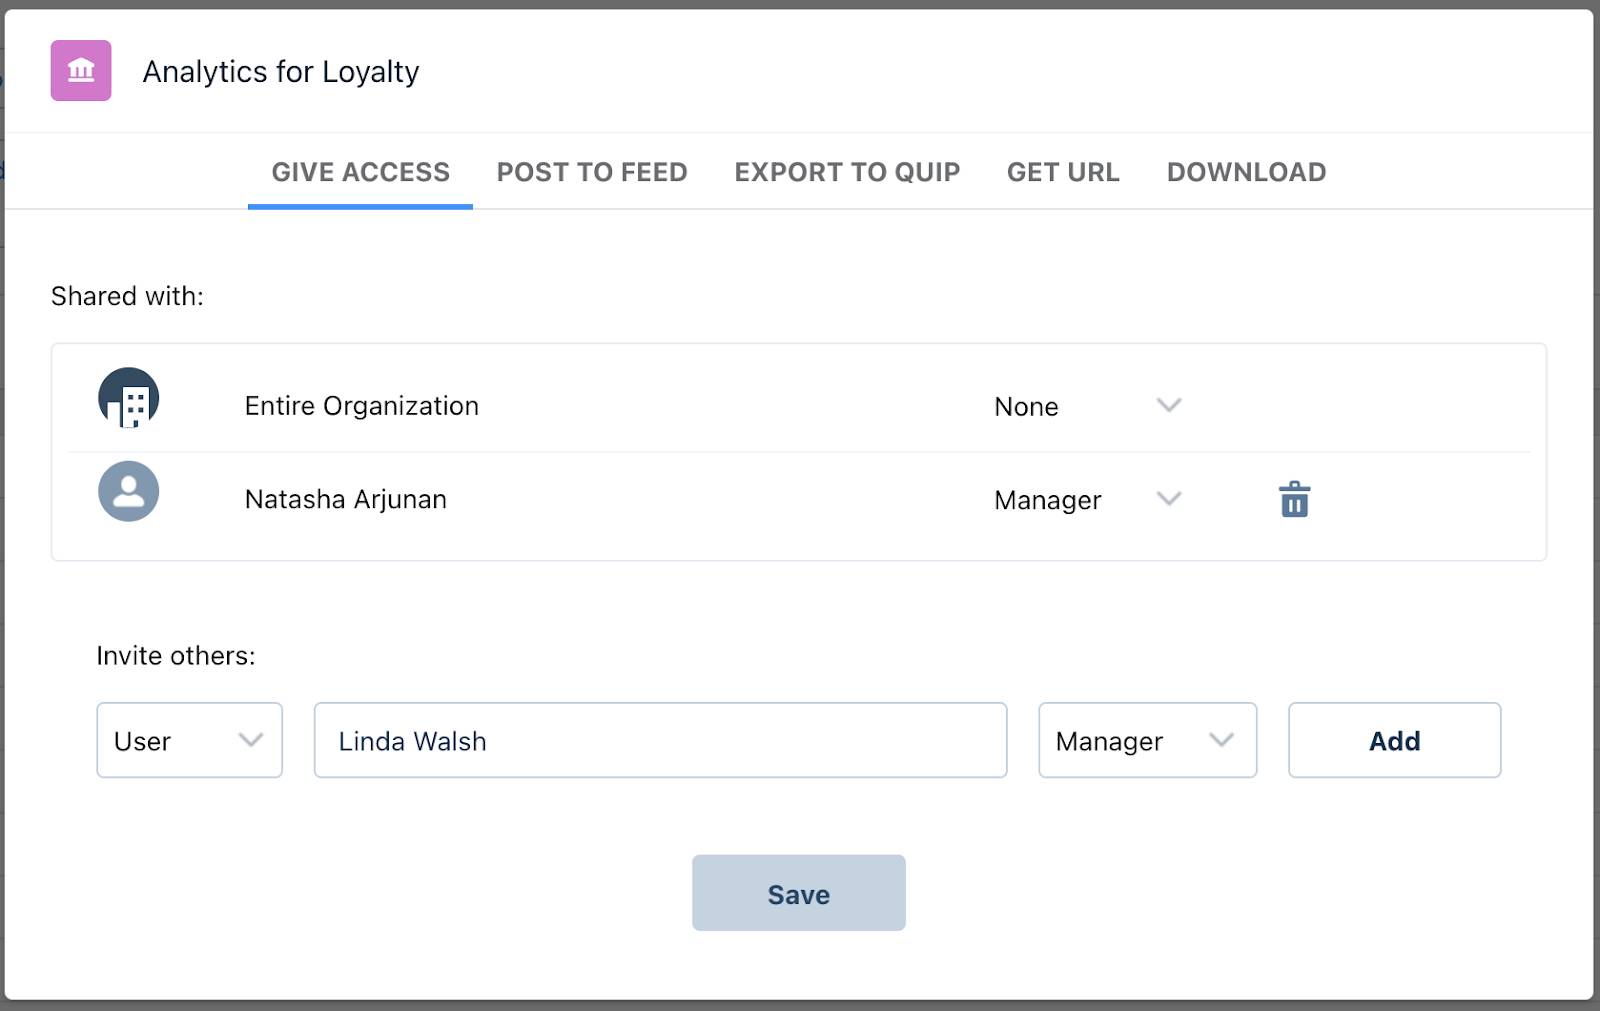
- In the Give Access tab of the Analytics for Loyalty window, use the search field under Invite others to find users in the org. Enter a user’s name:
Linda Walsh.
- Select the access level for the user: Viewer, Editor, or Manager.
- Click Add.

- Repeat steps 2–4 to add other users.
- Click Save.
Jenny provides access to all the key users in the loyalty program. She can make modifications to the access as and when needed. The team can now use dashboards to understand member engagement, create target campaigns and promotions, and design partner and acquisition strategies.
In addition to the Analytics for Loyalty app, Loyalty Einstein Discovery apps provide predictions that help improve member engagement and increase promotion revenue. Jenny wants to set these up for Linda.
Create an App from the Predictive Templates
Einstein Discovery apps help loyalty managers predict promotion-influenced revenue, determine the likelihood of member inactivity, and manage liability. Similar to the Analytics for Loyalty app, predictive apps are available in two templates.
- Prediction for Member Engagement App
- Prediction for Promotion Revenue App
Jenny creates an app for each of these templates. She follows similar steps as listed in the Create and Share an App from the Template section, with a few exceptions. You can view the full list of steps to create and share an app from a predictive template in the Create an App from the Predictions for Member Engagement Template help topic.
Jenny has made progress but wants to make things more convenient for the team. She decides to embed a dashboard on the home page so that it’s the first thing Linda sees when she logs in.
Embed Dashboards on the Loyalty Home Page
The Analytics for Loyalty app includes dashboards that you can embed and access in Lightning Experience pages. Jenny wants to display the Program Overview Lite dashboard on the home page. It’s a valuable addition because it gives Linda a view of the program's performance as soon as she logs in. Here’s how Jenny adds the dashboard to the home page.
- Click
 , and select Loyalty Management.
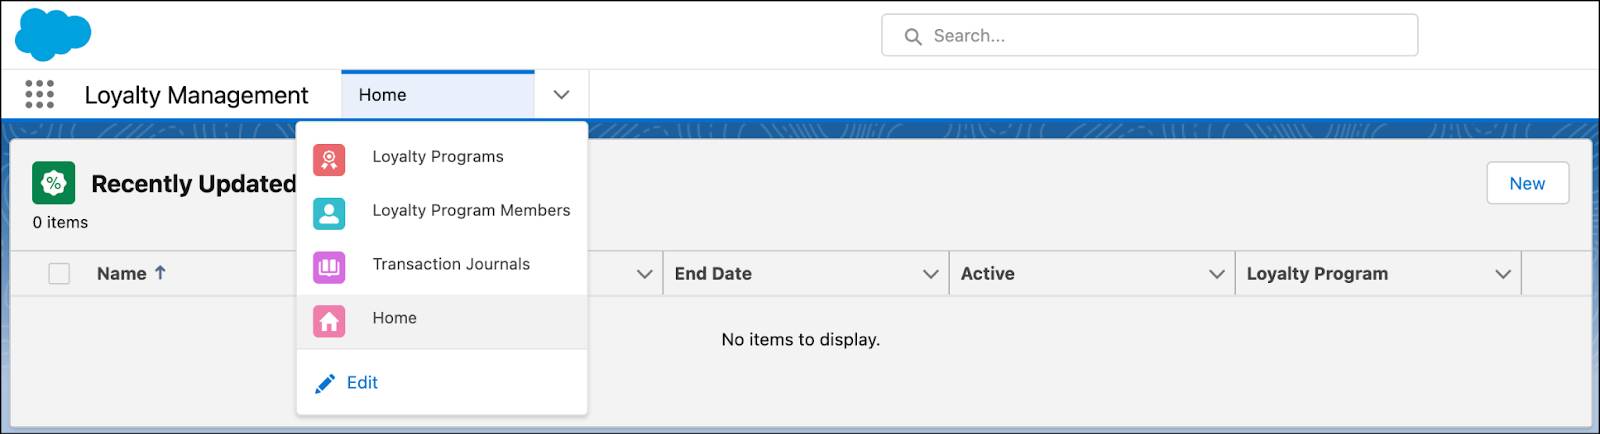
- Click the Loyalty Management navigation menu dropdown, and select Home.
- Click
 , and select Edit Page. The Lightning App Builder page appears.
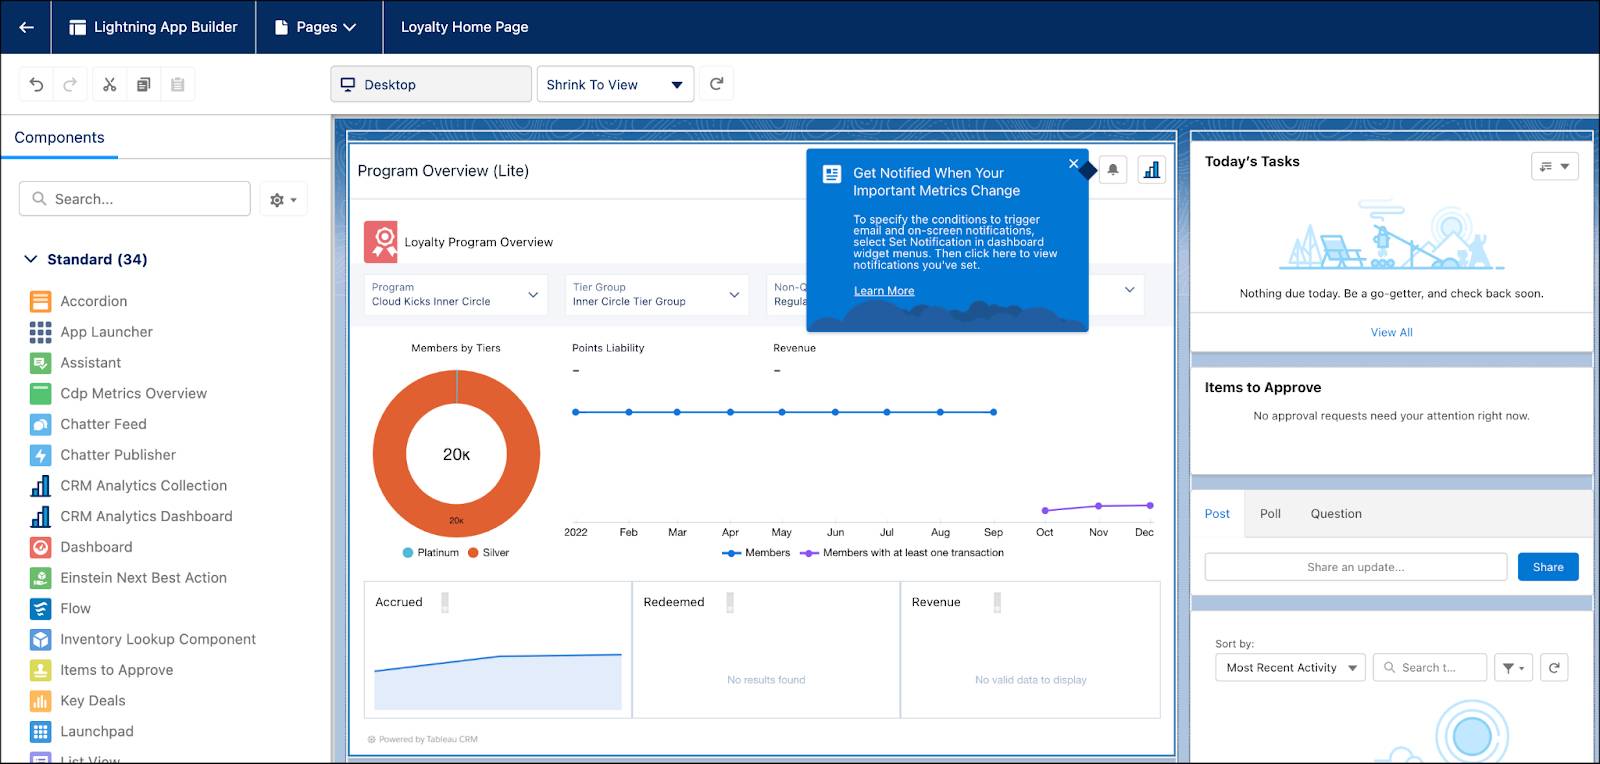
- Drag the CRM Analytics Dashboard component on the left to where you want it to appear on the page layout.
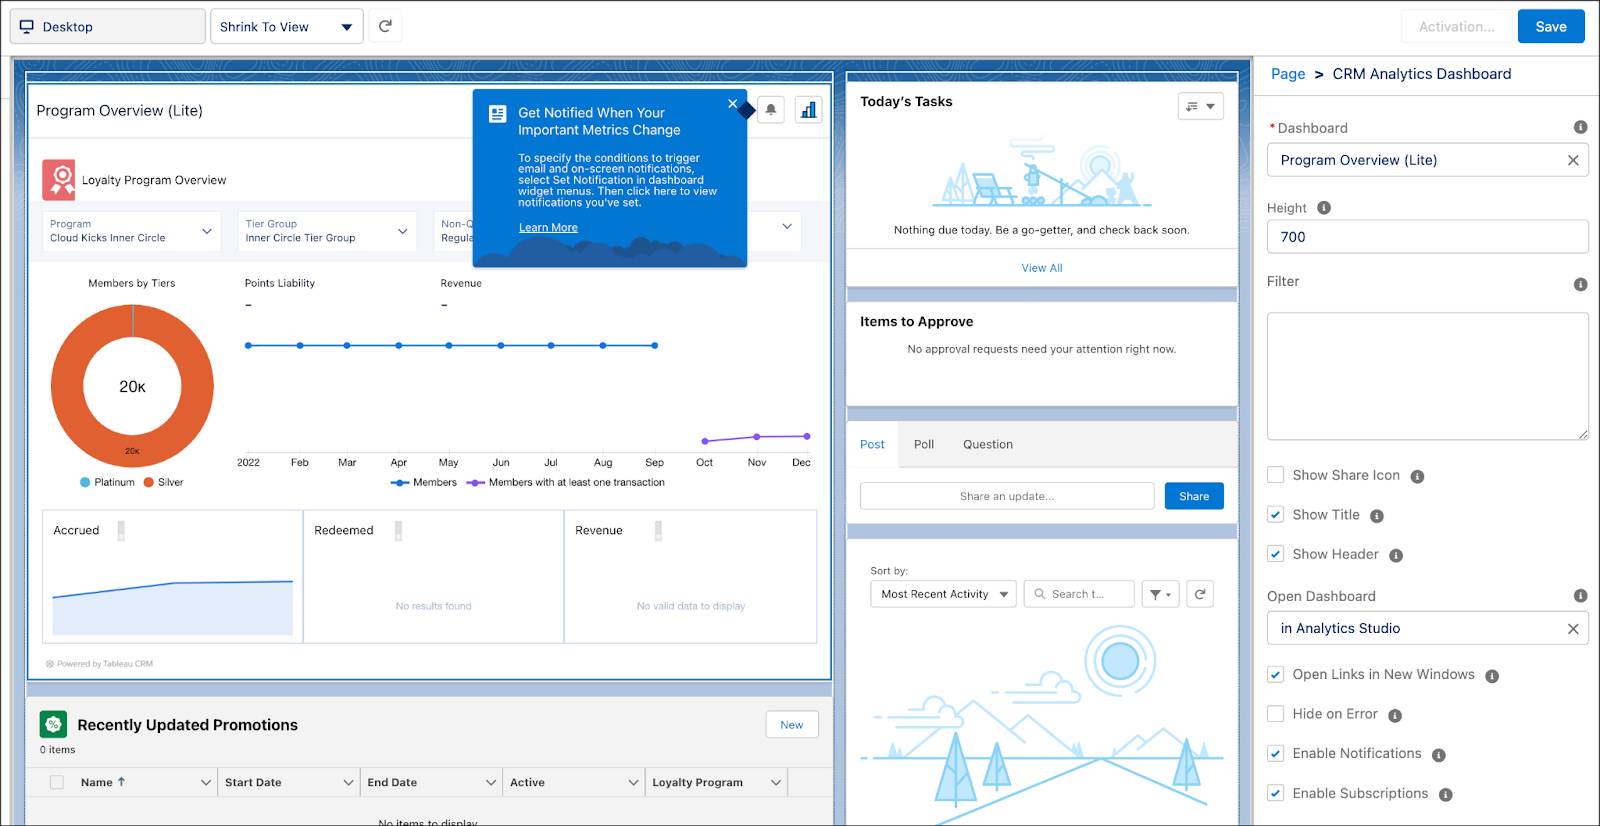
- On the settings panel to the right, add the following details.
- Dashboard: Program Overview (Lite)
- Component height:
700 - Select Open the Links in New Windows
- Click Save.
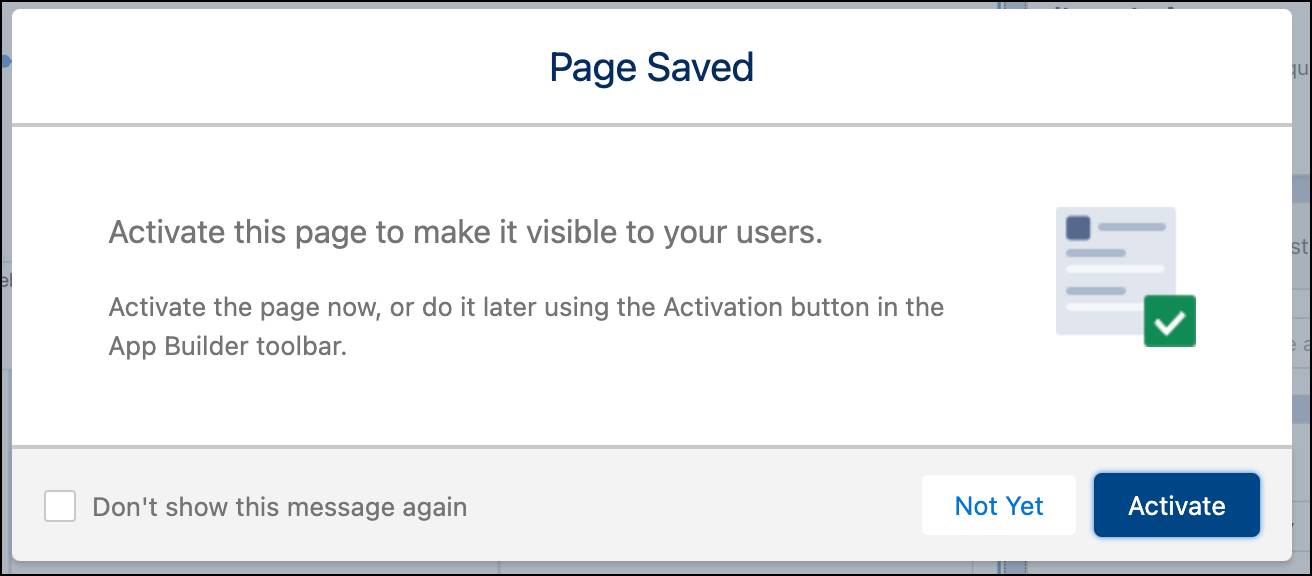
- In the Page Saved window, click Activate.

- In the App Default tab, click Assign to Apps.

- Select Loyalty Console and click Next.
- Click Save.
Jenny navigates back to the home page to review how the dashboard looks. The CRM Analytics setup is nearly done. Before Jenny can pat herself on the back, there’s one more thing she must take care of. She has to ensure that the app is always up to date. Let’s look at how she sets this up.
Schedule Recipe
When Jenny created the app, a recipe imported the latest data from Loyalty Management to CRM Analytics. So the dashboards have the most recent data. Each day new transactions and data are loaded into the Loyalty Management app, which means data is constantly changing. Jenny schedules the recipe to run every day so that the app uses up-to-date data. Here’s what she does.
- Click
 , and select Analytics Studio.
- Click
 , and select Data Manager.
- In the left panel, click Manage Dataflows. The Data Manager page opens. Here you can track the progress of syncs, dataflows, recipes, and other data jobs.
- Click Dataflows & Recipes.

- In the Recipes tab, look for Analytics for Loyalty Loyalty Analytics Part1 and click
 .
.
- Select Schedule, and set the mode, time, and day for scheduling the recipe and updating data in your app. The Schedule Mode can be time-based or event-based. An event-based schedule is related to Salesforce local connection syncs, specific recipes, or dataflow runs. A time-based schedule is related to a defined time. Set a time outside normal work hours so the dataflow doesn’t interrupt business activities.
- Click Save.
- Repeat steps 5–7 to set the schedule for the remaining loyalty recipes.
Jenny schedules the recipe to run every day at 12 AM, all days of the week. So each morning, when Linda or the team logs in, they see the latest data in the dashboards.
Jenny has successfully deployed CRM Analytics for Loyalty and the team is thrilled with all the visual data at their disposal.
In Conclusion
The Analytics for Loyalty app has transformed the way Linda answers critical business questions. It has helped the team increase membership, retain customers, improve processes, and grow the business. The predictive apps provide AI-powered predictions and prescriptive recommendations. And Linda’s excited to see the team use dashboards to improve member satisfaction, meet performance targets, build high-performing teams, and do so much more!