Calculate with the Compare Table
Learning Objectives
The Exploration Goal
Here’s your goal for this unit: You want to show projections for the percentage of total sales versus digital media sales for the next few months. Charts are great to see the big picture and trends, but there’s nothing like numbers to prove a point. Having both when you present your contest plan will put you ahead of the game.
This goal introduces a new concept that we haven’t covered yet: how to do calculations in CRM Analytics. The compare table is an effective tool for doing that with just a few clicks.
Calculate the Percentage of Total Sales that is Digital Media
(# of digital media sales / # of all sales) x 100
Let’s get those numbers and perform the calculation.
The Compare Table
- Click
 .
. - Choose Compare Table.
As shown when you hover over its icon, the compare table is a column-based visualization. It’s different from the visualizations you’ve seen before. Each column has its own filters and measure, and some of the columns can be used to do calculations. You can also add up to ten groupings that are applied to every column, as you’ll see later.
Column A: All Won Opportunities
- In the Data tab, click Count of Rows.
- Select the Sum aggregation function on the left.
- Select the # (quantity, not amount) measure on the right.
- One filter is the past few months and next few months.
- Another filter is won opportunities.
- Next to Sum of #, click the menu control (v).
- In the menu, select Add a Filter.
- Select Close Date.
- Select Custom.
- Select the Absolute date range tab and the Between operator.
- Set the From field to September 10, 2020, three months before today. (Remember, for our example, today is December 10, 2020.)
- Set the To field to February 10, 2021—two months in the future.
- Click Add.
- To add the second filter, click the v next to Sum of # and select Add a Filter again.
- Select Won, then select true, and finally, click Apply.

- Click the v next to Sum of #, and this time select Edit this Column.
- In the Column Header field, enter All_Sales.
- Click Apply, and then click Close to close the edit panel.

Column B: Digital Media Won Opportunities
- Click the menu control (v) next to All_Sales (the new name of Column A) under Columns.
- Select Clone Column. When a cloned column is created, it copies all the filters and measures from the column that it’s created from. Easy, right? Now we’ll add a filter to Column B where Product Family equals Digital Media.
- Click the v for the second All Sales (Column B) and select Add a Filter.
- In the search field, type product, then select Product Family.
- Select Equals in the Operator pull-down menu, select Digital Media from the Values list, and click Apply.

Notice that you can scroll the Data panel. It should show that your second column now has three filters. Time to rename the column to Digital Media.
- Under Columns, click the menu control (v) next to the second All_Sales (Column B).
- Select Edit this Column.
- In the Column Header field, enter Digital_Media.
- Click Apply, and then click Close.
Now you’re ready to do the calculation!
Column C: % of Digital Media Won Opportunities
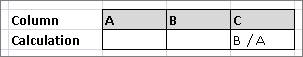
- Click the menu control (v) next to # Digital_Media (Column B) under Columns, and select Clone column.
- Click the menu control (v) of the new column, and select Edit this Column.
- Change the column header to % Digital_Media.
- In the formula field, put the formula defined above: B/A.
- For the format, select Percentage.

- Click Apply, and then click Close.

Group in a Compare Table
- In the Data tab, click the plus sign (+) under Group by.
- Select Close Date.
- Select Year-Month.
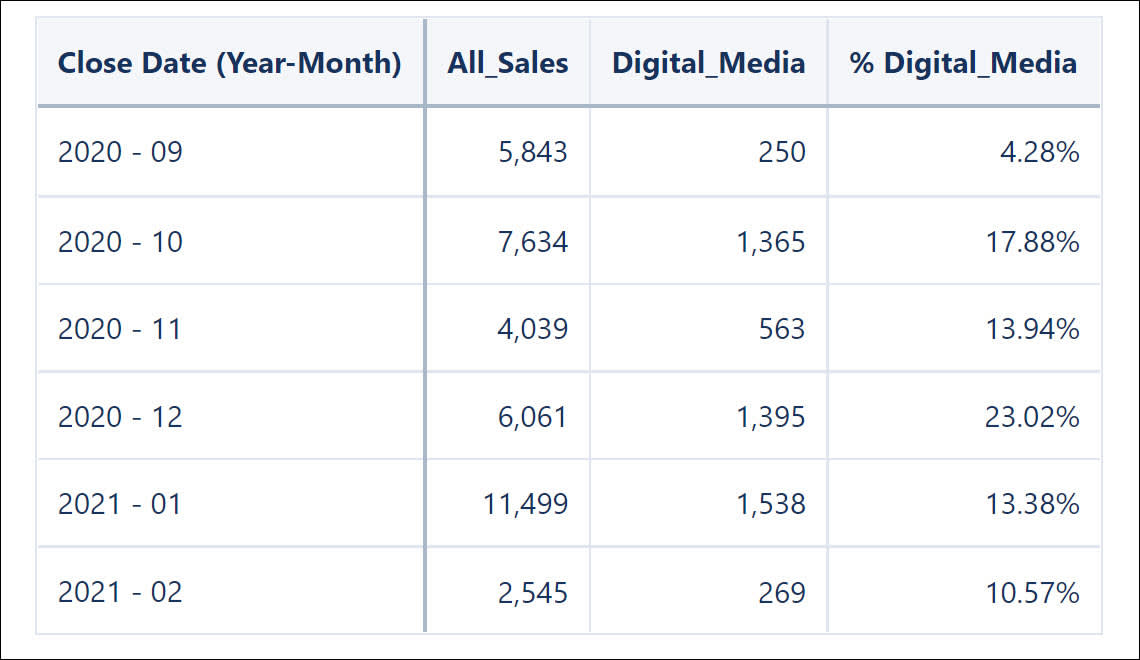
Voilà! The query is grouping by the closed month and getting the results of each column for all groups. The numbers show us that digital media sales have been mediocre lately, even though they’re spiking this month (remember, it’s December 1!). And looks like they’re headed back down in January. c
We’re going to need that contest to get the digital media results DTC’s looking for, to boost the product in the home and education markets. To help convince the rest of the team, let’s turn the numbers into a picture.
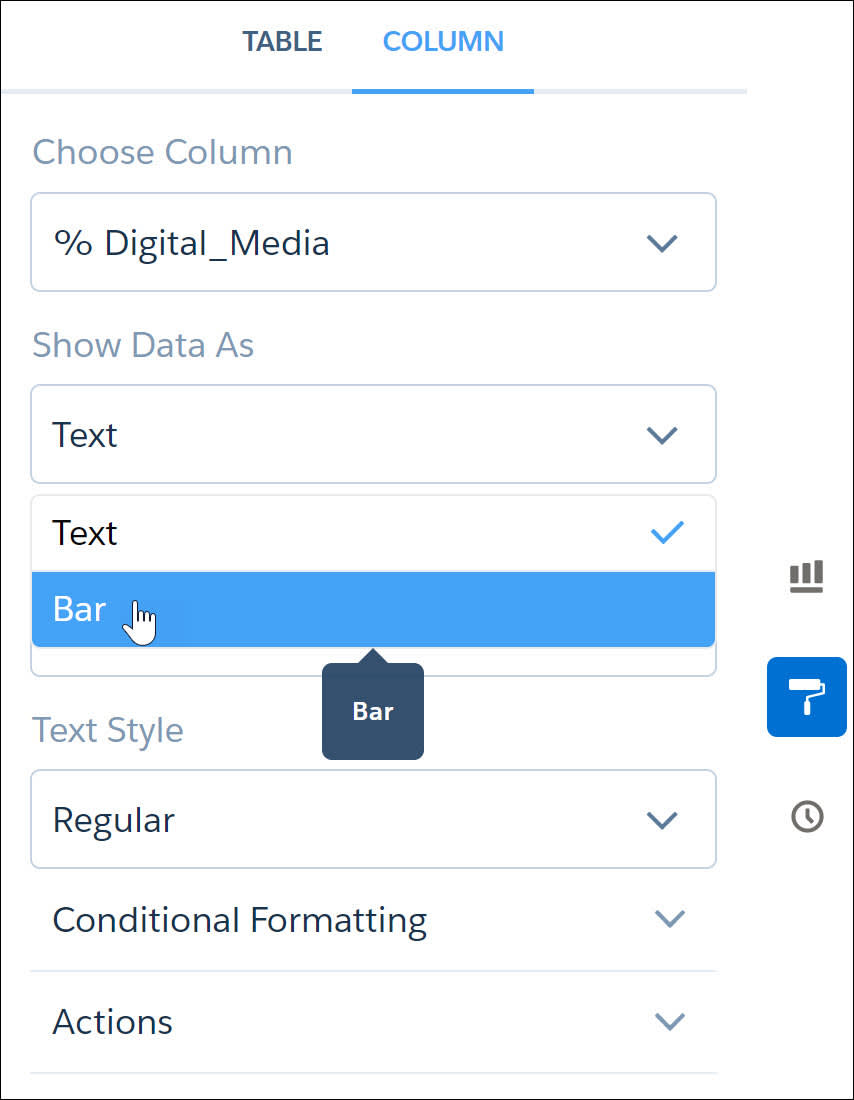
Show Results as Bars
- Clone the % Digital_Media column.
- On the new column under Columns, click the menu control (v) and select Format Column.
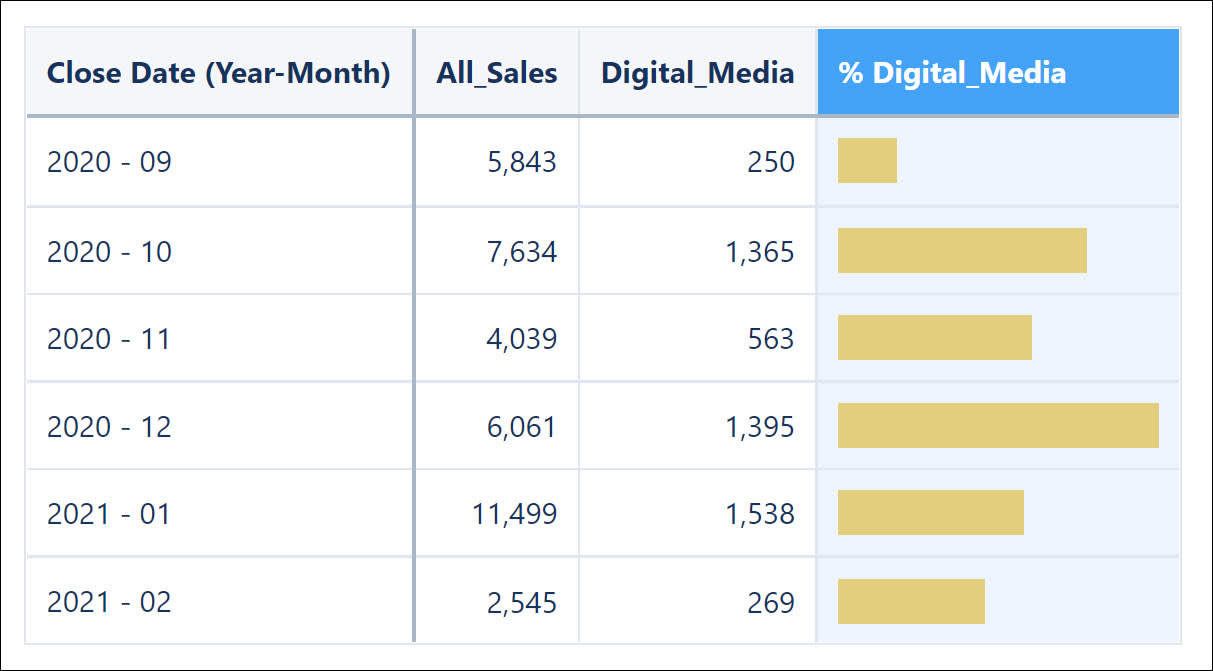
- In Column Properties, select Show as Bars.
With this visualization as part of your table, you’ll be able to make your point about digital media performance much more effectively.
The next step: to find out how to get more deals closed this month. But you’re running out of time. You need to jump in a taxi and head to the airport, so you can’t continue your exploration on desktop. In the next module, you’ll see how to keep going with your research, but this time on your phone.
Save Your Exploration in a Lens
Get Ready to Go Mobile
- A digital media sales leaderboard that you can leverage to help your best sales rep share best practices.
- A timeline that illustrates a slowdown in digital media sales.
- A compare table that shows the percentage of digital media sales through time.
Be proud of yourself—you deserve your badge! You might be standing in the taxi line, but your work’s not finished yet. And you don’t have time to wait until you’re back in the office. That’s why, in the next module, we’ll show you how to explore data on your mobile device, so you can take action on the go. A new world of explorations will open up to you. Ready?