Get Started with CRM Analytics for Sales

Learning Objectives
- Understand the value that Sales Analytics offers your business.
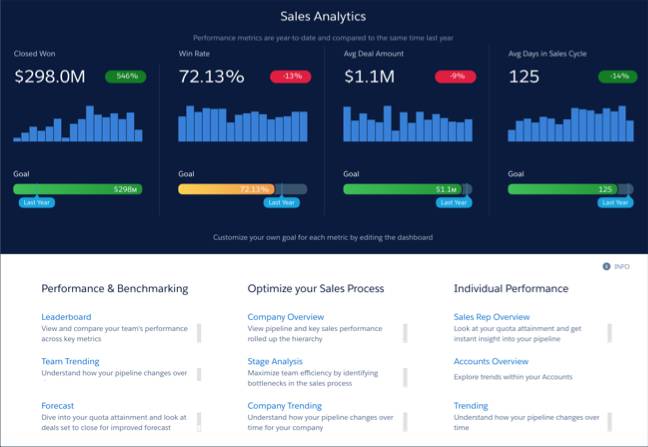
- Explain how Sales Analytics lets you visualize key performance indicators and answer important questions about your sales data.
- Understand that setting up Sales Analytics usually follows an iterative, step-at-a-time process.
Why Your Team Needs Sales Analytics
At DTC Electronics, you’re a long-time user of Salesforce for managing customer interactions. The old way of doing analytics wasn’t working. It could take days, even weeks to get IT to assemble the reports needed by the sales team to take action. Part of the problem is the folks in IT need to know exactly what you’re looking for before they act on a request.
But now, the CEO has decided to standardize on the Sales Analytics app for performing analytics on your sales data. Why? Because of its promise to provide a fast, intuitive way to give you insights about your Sales Cloud data—without you first needing to know all the questions you’re trying to answer.
Sales Analytics is one of the prebuilt CRM Analytics apps from Salesforce. It draws on best practices we’ve gleaned from Salesforce’s many years helping manage customer interactions.
The app anticipates the way you likely want to manage and analyze sales processes and data. It provides dashboards targeted to meet the analytics needs of three key roles on your sales team:
- Sales managers. Start with an overview dashboard to show your team’s KPIs in a single place. Then follow links to details about the pipeline, team productivity, quota progress, and sources for new business.
- Sales reps. Start with your own overview dashboard containing individual KPIs. Then dive into detail dashboards to discover opportunities to upsell/cross-sell to recent customers, get blink-of-an-eye account and opportunity summaries, and stay on top of your quota.
- Sales operations staff. Get key insights from dashboards highlighting sales performance and other operational KPIs.
Of course, you have your own scenarios for how you want to use sales data. So we’ve left key decisions to you. That’s where the app’s handy configuration wizard enters the picture. Think of the wizard as a robot that takes care of building your app for you. But a robot is only as smart as the instructions you give it. So the wizard asks a series of questions about the way you track and look at data in the Sales Cloud. Based on your answers, Sales Analytics builds dashboards and KPIs in a way that’s meaningful to you. If things aren't perfect, you can use the power of the CRM Analytics platform to do some deeper customizations.
Using Sales Analytics to Visualize KPIs
You’re the Salesforce admin for DTC Electronics, and you just got an urgent email from Laura Garza, DTC’s worldwide sales manager. She needs to use Sales Analytics, and she needs it fast. Her boss, the CEO is flying in to visit Laura next week to review the quarter. At the meeting, she needs to show the CEO her team’s key performance indicators. She hopes that together they can get a clear picture of where things stand and take action to drive the sales team toward a successful quarter.
She wants to be able to answer questions like:
- How is the quarter going? What are the top-line results so far?
- How am I doing against my target, and what's the forecast looking like?
- Who are my top performers and how are they doing against their targets?
- What are the biggest opportunities my team can push on to make this a great quarter?
Like you, she knows the answers are all somewhere inside your Sales Cloud data. She’s also sold on the app’s promise. So you set aside an afternoon to get the app up and running. Your goal: To give Laura what she needs to use Sales Analytics to provide an overview of the business for her meeting with the CEO.
Try, Try Again with an Iterative Approach
We’ve made it easy to get going with Sales Analytics by providing a basic app creation option. Basic create uses standard settings to give you an immediately useful baseline. It’s the same result as if you choose Custom create and use all the configuration wizard default settings. You can see if the basic version meets your needs and then iterate from there.
As you use Sales Analytics, you’ll see that the app takes on a life of its own following a life cycle that looks something like this:
- Create the app using the basic app creation option.
- Have a look at it, see what works and what doesn’t, and create it again, this time using the custom creation option. With custom creation, the app configuration wizard guides you through a set of questions to help you choose the right custom settings. The app keeps track of the answers you select each time, and you can also easily delete each version of the app you create.
- Show the app around and get feedback, then create it again based on what your team needs.
- As the team uses the app and tells you what more they need, customize it, add functionality, change data security, and so on.
Learn How to Create and Use Sales Analytics
In this trail, you’ll take the first steps down that agile path by creating and using Sales Analytics. We’ll do some hand-holding, but you probably won’t need much! Be sure you’ve already gone through the previous Trailhead module, CRM Analytics Apps Basics, so you’re familiar with apps. We assume you have a Salesforce Developer Edition account, which you set up there.
Before jumping into the next unit where you’ll create your own version of the app, take a few minutes to work your way closer to the Sales Analytics Trailhead badge by answering the challenge questions.