Identify Stuck Sales Deals
Learning Objectives
After completing this unit, you’ll be able to:
- Explain why it’s important to spot opportunities not moving through the sales cycle.
- Create reports and build dashboards to help identify stuck deals.
Introduction
Sales teams are always looking for ways to find new leads and close deals fast. We know that stagnating opportunities typically account for about 10 to 15 percent of the average sales pipeline. These stalled deals can upset your sales team’s performance. But with a few easy steps, you can help your team get insight into why these sales deals aren’t moving—and get them back on track.
In this module, you’ll:
- Build a custom report to identify stalled opportunities.
- Add a dashboard component to get visibility into stuck deals.
Let’s Get Started
If you’ve earned other Trailhead badges, you’re used to getting hands-on in your personal Trailhead Playground. For this module, we’re taking a slightly different approach.
We recommend you use your company’s production org. Since you will just be building out reports and dashboards, it’s perfectly fine for you to follow along in your company’s org as you build out the new report and dashboard component. You can keep the report in a private folder until you’re ready to deploy it to your users.
You can use your free Trailhead Playground to follow along if you prefer.
Preparation
Before you start the step-by-step instructions, there is one important thing you need to do first. We build reports around a field on the Opportunity called Stage Duration. This field tracks how long an opportunity has been in the current stage of the sales cycle. Many companies have rules about acceptable stage durations as part of their sales process. Stage durations can vary widely—some organizations have very long and complex sales processes and others have a more streamlined sales cycle. Work with your sales leadership to determine suitable stage durations for your business before tackling the next step.
Build a Stuck Opportunities Report
The first thing on our checklist for identifying stuck deals is to create a custom report. Here’s how.
- Click
 and select the Sales app.
 - Click Reports in the navigation bar.
- Click New Report.
- Enter
opportunitiesin the text box, and select Opportunities in the report type selection popup. - Click Continue.
- Once the report preview loads, click Outline. Let’s get rid of a few columns in the report that we don’t need. Click the X next to the following fields in the list to remove them from this report.
- Owner Role
- Fiscal Period
- Expected Revenue
- Probability
- Created Date
- Lead Source
- Type
- Let’s add a new column for the Stage Duration field. Click Add column... and type
durationin the text box. Select Stage Duration to add it to the report. - In the report preview pane, scroll to the far right and click
 next to the Stage Duration column heading. Select Summarize and then deselect Sum.
 - In the report preview pane, look for the Amount column and click
 next to the Amount column heading. Select Summarize and then select Sum.
 - Next click Add Group just below GROUP ROWS. Type
ownerin the text box, and select Opportunity Owner to group the report. - Add a second group by clicking Add Group just below GROUP ROWS again. Type
stagein the text box, and select Stage to group the report. - Click Filters.
- Click Close Date and update the range picklist to All Time. Click Apply.
Next we’re going to build filters around the stage duration field. For this example, we’re going to use the following table of stage duration thresholds.
| Stage |
Stage Duration Threshold (days) |
|---|---|
| Qualification |
30 |
| Discovery |
45 |
| Proposal/Quote |
15 |
| Negotiation |
30 |
- Click Add Filter. Type
Stageinto the text box and select it. - Keep the operator set to equals, and then select Qualification for value. Click Apply.
- Click Add Filter and type
Stageinto the text box. Select Stage Duration. - Set the filter operator to greater than, and enter 30 for the value. Click Apply.
- Repeat steps 1–4 for each of your opportunity stages and discount thresholds (see above).

For our example above, here’s how this looks when complete.
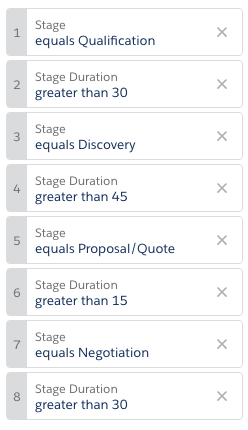
Now, let’s add custom filter logic as follows.
- Click next to Filters and select Add Filter Logic.
- In the edit filter logic text box, update the default values of 1 AND 2 AND 3 AND 4 AND 5 AND 6 AND 7 AND 8 to the following.
(1 AND 2) OR (3 AND 4) OR (5 AND 6)OR (7 AND 8)
- Click Apply.
- Click Save & Run.
- Name the report
Stuck Opportunitiesand store the report in your private reports folder for now.
Next let’s add a chart to this report and visualize the amount of stuck opportunities per sales rep. Here’s how.
- With the Stuck Opportunities report open, click Edit.
- Click Add Chart.
- Click
 to open chart properties. Select the Stacked Bar chart type.
 - Verify that the X-axis is set to Sum of Amount, and Stack By is set to stage.
- Click
 to close the chart editor.
 - Click Save & Run.
Here’s an example chart from this report. Yours can look different depending on the opportunity data in the org you’re using and the stage duration thresholds you configured.
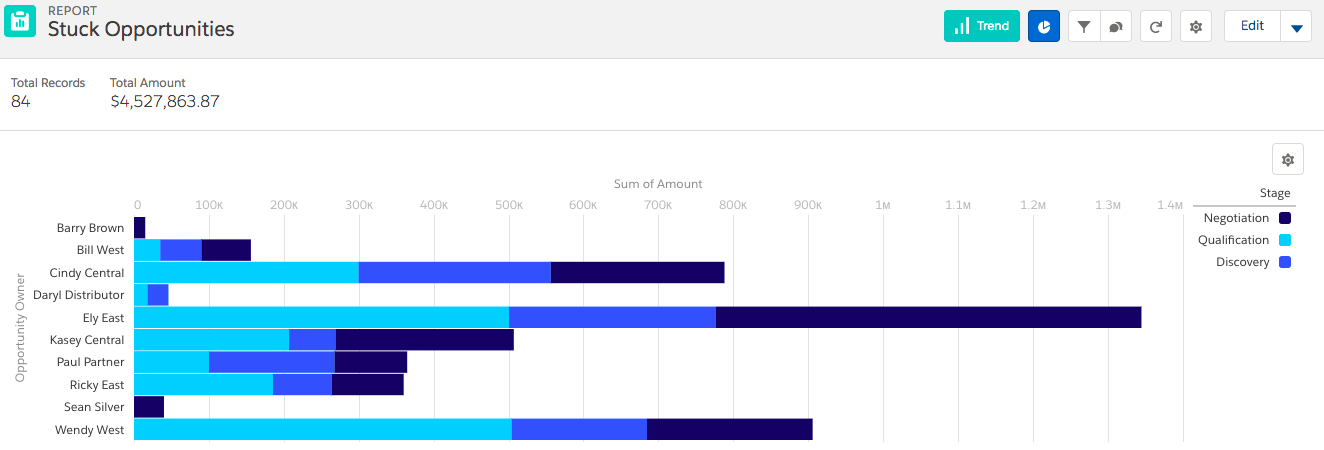
Based on the thresholds we defined, there are $4.5 million worth of stalled opportunities. Ouch! This sales team has some work to do.
Once you’ve got this basic report configured, review with sales management and get their input. Are the stage thresholds appropriate? Is anything missing? Incorporate their feedback and adjust the report if necessary. When the report is ready to deploy, you need to move it to a folder that your sales team can access. Here’s how.
- Click Edit on the report and click
 next to the Save button. Select Properties.
 - Click Select Folder, and then select a new folder to store the Stuck Opportunities report. Make sure to select a folder that your sales team can access.
- Click Save.
Resources
Build a Report in Lightning Experience—Salesforce Help Article
Reports & Dashboards for Lightning Experience—Trailhead Module