Make Data Do the Talking with Conditional Highlights
Highlight Key Insights with Conditional Formatting
Dashboards can be chock-full of insights. With so much information to take in, it can be easy for users to miss something. Thankfully, there’s a way to assure they don’t. Conditional formatting can help you draw users’ attention by dynamically highlighting specific information in tables, charts, and number widgets.
To address the program director’s concern about information being overlooked, you decide to add conditional formatting. You’ll use it to bucket account owners in high, middle, and low performers and call attention to large donations.
Make It About Performance
In the original dashboard, you sorted the list of account owners by how much money they added to the donation pipeline to identify top performers. In the new version, let’s categorize them visually into three buckets with conditional formatting: top, middle, and low performers.
- Go to the Worldwide Fundraising In Progress dashboard. It should still be in edit mode. Note: If you close the dashboard and need to navigate back to it, you can find it in your My Private App in the Analytics Studio home menu. Make sure you click the Edit button to edit the dashboard.
- Select the Top Account Owners widget.
- In the widget properties, scroll down to the Conditional Formatting section and expand it.
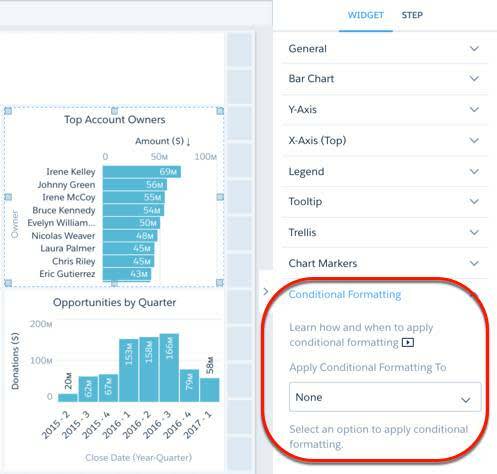
- In the Apply Conditional Formatting To field, select Sum of Amount. You can color a measure’s value using a gradient or bins. Gradient is selected by default. Let’s use bins to clearly distinguish the three buckets of performers.
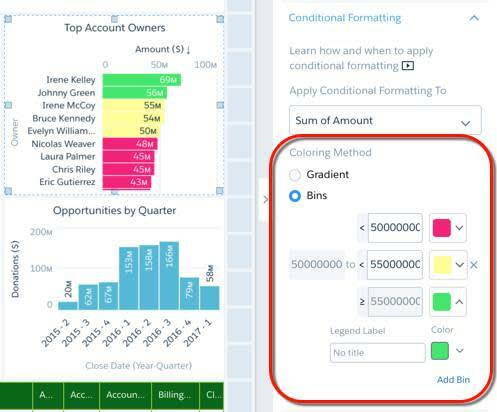
- Select Bins.
- To create a third bin, click Add Bin.
- Set the following value and color for each bin. Tip: When you enter values, don’t include commas. You can choose any shade when selecting a color.
Bin
Value
Color
Low Performer
<
50000000Red
Middle Performer
50000000to <55000000Yellow
Top Performer
>
55000000Green
-
- Save the dashboard.
Nice work. Now the ABC Seed director can easily see which account owners to congratulate and which to offer assistance. In the next section, you call attention to the large donation opportunities in the table so they don’t slip through the cracks.
Let’s Call Out Large Donations
Time to bring extra attention to large donation opportunities.
- At the bottom of the dashboard, select the table widget.
- In the widget properties pane on the right, select the Column tab.
- In Choose Column, select Opportunity Name.
- Expand the Conditional Formatting section, and click Add Rule.
- Base the coloring on the amount by selecting Amount in the Reference Column.
- In Coloring Method, select Is Greater Than Or Equal To.
- Enter
1000000as the value. Again, don’t enter commas within the value.
- Set the background color to green.
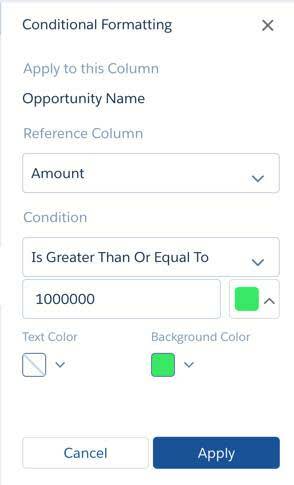
- Click Apply.
- Save your dashboard.
Now, large donation opportunities are highlighted in green, making them easy to see. 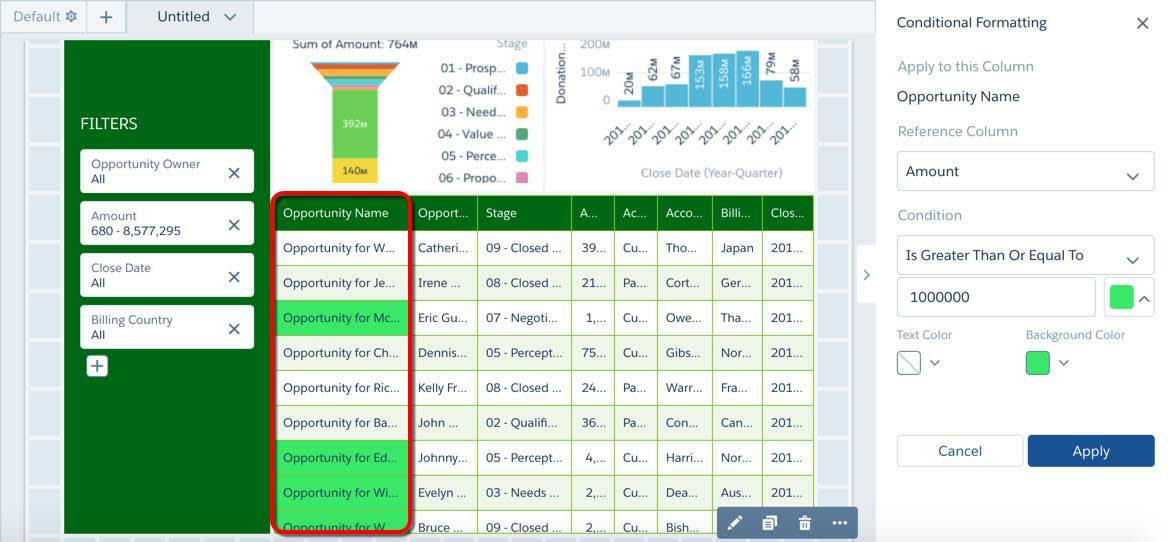
Wow, your dashboard has come a long way fast! Next, you break up all the information to make your dashboard easier to digest.
Resources
- Video: Automatically Highlight Your Dashboard with Conditional Formatting
- Help: Automatically Highlight Data with Conditional Formatting