Meet Visual Reports
Learning Objectives
After completing this unit, you’ll be able to:
- Describe the purpose of visual reports in Spiff.
- Find and filter standard reports included with Spiff.
Visualize Your Commission Data
Visualizing commission statements through reports and graphs provides sales leaders with a clear and immediate understanding of performance measures. By viewing commission data in aggregate and in visual formats, you can easily identify trends, outliers, and patterns in sales performance. You can make informed decisions swiftly, which is crucial in any fast-paced sales environment.

Salesforce Spiff is a leading sales compensation software that automates and simplifies the process of calculating and managing sales commissions. And it gives you two types of visual reports: custom and standard. In this module, you learn how to create and manage custom and standard visual reports in Spiff. With these reports, you can improve your incentive compensation strategy to motivate your sales staff and boost revenue.
Visual Reports in Spiff
With visual reports, Spiff admin and finance users can run visualizations that compare commission measures of their sales reps. These reports are easily exported to share or save for reference.
Whatever report you’re using, team structure visibility applies to the report. Managers and editing managers can create and retain standard visual reports, but can only see information on reports for users that are part of their respective teams in Spiff. For example, if the manager for Team B views a report for the whole company, they only see data from Team B. If the report is shared with another manager with rights to only teams A and C, then that person only sees data for teams A and C.
In this module, we assume you are a Spiff administrator with the proper permissions to manage reports. If you’re not an admin for Spiff, that’s OK. Read along to learn how your admin would take the steps in a production org. Don't try to follow these steps in your Trailhead Playground. Spiff isn't available in the Trailhead Playground.
To find visual reports, click Reporting in the Spiff navigation, then select Reports. This takes you to the Custom Reports list.
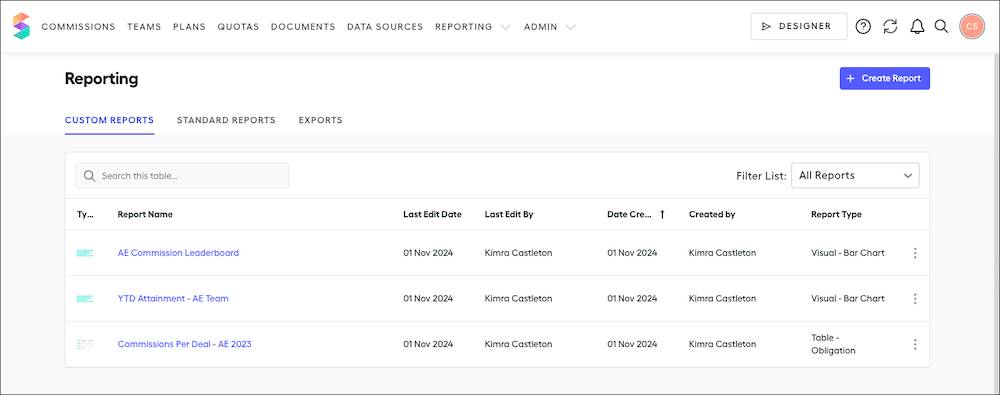
If you’re accessing an existing report, you can filter the reports in the list by All Reports or My Reports, which only displays reports created by you.
Explore Standard Visual Reports
There are five included, standard options for visualizations in Spiff, listed here with their name on the Standard Reports list and each report’s display title.
- Commission Leaderboard (Commission Leaderboard)
- Commissions By Rep Over Time (Commissions By Rep Over Time)
- Rep Avg By Plan (Average Rep Commissions By Plan)
- Rep Avg By Plan Over Time (Average Rep Commissions By Plan Over Time)
- Total By Rep (Total Commissions By Rep)
Find these reports by clicking Standard Reports on the Reporting page.
In addition to standard reports, you can create your own line or bar graph for any calculation that you want to visualize, like attainment, year-to-date sales, and so on.
Before you dive in, know that all amounts in standard reports have been converted to your chosen corporate currency. The system uses the conversion rate effective at the beginning of the defined period.
You can customize each of these standard reports, but the filters you use to customize them are only temporary. Each report reverts to a rolling three-month period when you leave the report. Export your report as an .svg, .png, or .csv file to save the customizations and filters in your report.
To export a standard report:
- On the visual report, click
 on a bar chart or
  on a line chart.
- Select the format for the file to download.
Let’s explore each standard report and how to customize it.
Commission Leaderboard
Commission Leaderboard sorts total commissions earned by each rep from highest earner to lowest.

Use the date picker in the Filters panel to define a date range. Additionally, you can specify a plan or team to include or exclude in the visualization. After you set the date, plan, or team filters, click Run to update the report.
Commissions By Rep Over Time
Commissions By Rep Over Time gives you more insight into your reps’ commission trends during the specified period.
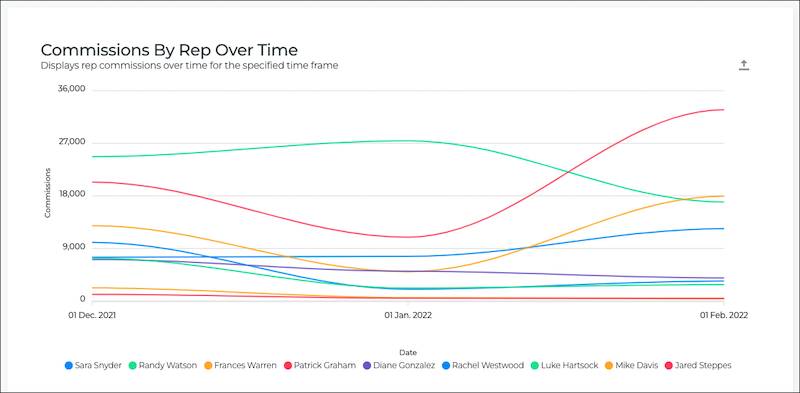
To eliminate the results from one or more team members, click their colored dot on the key to remove their line. This feature is especially helpful if you have some over- or under-achiever skewing the results.
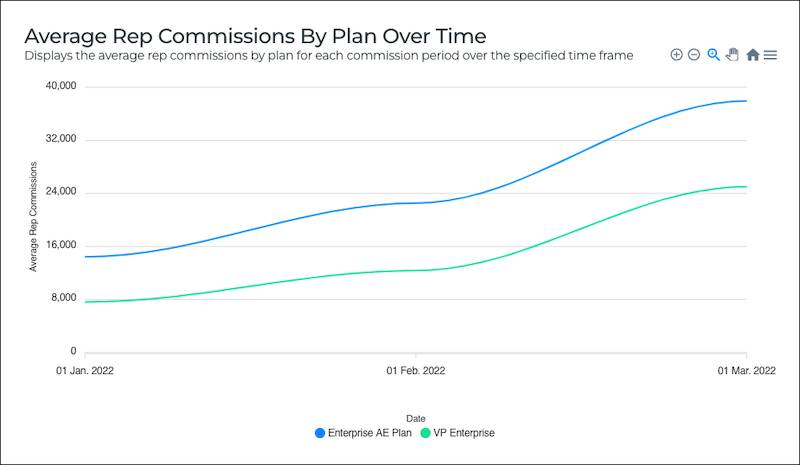
Average Rep Commissions By Plan
Average Rep Commissions By Plan provides more insight into the average commission earned across your reps for each plan.

You can filter the report by date, plan, or team. After you change the date range, plan, or team filters, click Run to update the report.
Average Rep Commissions By Plan Over Time
Average Rep Commissions By Plan Over Time can be used to track the average commission by plan trend over the specified period.
To eliminate the results from one or more plans, click their colored dot on the key to remove their line.
Total Commissions By Rep
Total Commissions By Rep generates a bar graph to compare the total commission earned by each of your reps in the specified period.

As with other standard bar chart reports, you can filter the report by date, plan, or team. After you set the date range, plan, or team filters, click Run to update the report.
Now that you understand the basics of standard visual reports in Spiff, let’s get into the details of custom reports. In the next unit, you learn how to create custom visual reports.