Sort Your Data
Lesson Objectives
After completing this unit, you'll be able to:
- Define and contrast computed sort and manual sort.
- Use computed sorts and manual sorts to organize data in a view.
What Is Data Sorting?
Data sorting is any process that involves arranging data into some meaningful order to make it easier to understand, analyze, or visualize. When working with data, sorting is a common method used for visualizing data in a form that makes it easier to digest the story you want to tell with the data.
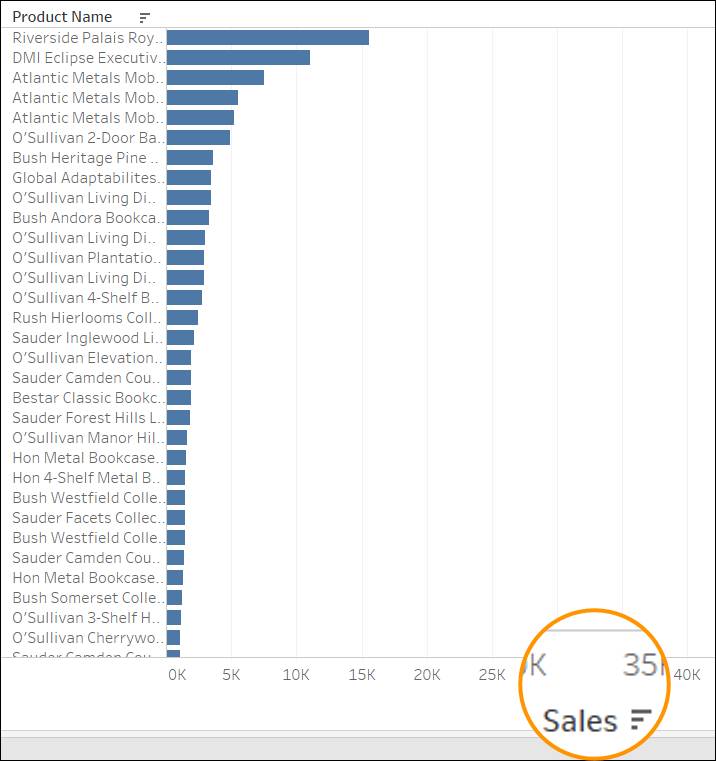
As you are analyzing your company’s sales data for furniture, you’re looking to answer this question: Which bookcase has the most sales?
Consider the example below. 
View A tells you Riverside Palais Roy bookcase has the most sales. View B does not tell you that right away. That’s because view A is sorted by Sales, while the data in view B is sorted alphabetically. This example gives you an idea of why the right sorting of data is important to quickly ask questions of your data.
Tableau has multiple methods for sorting data in views, including computed sorts and manual sorts.
Computed Sort vs Manual Sort
Let’s start by understanding the difference between the two sorting methods available in Tableau. Check out the video to learn the difference between computed sort vs a manual sort.
Computed Sorts
A computed sort organizes the data in the view by applying rules, such as sorting alphabetically or sorting quantities in descending order. Computed sorts are dynamic. If the data changes, the view will update to keep the computed sort order. There are several ways to create a computed sort.
Sort Using One Click
If the field is in the view, a computed sort can be created using one click.
- Hover over an axis, and click the sorting icon when it appears.
- Or, on the toolbar, click either the ascending or descending sorting icon. If you hover, a tooltip appears that describes how the sort will be performed (based on fields in the view and current view selections).
Sort Using the Sort Dialog
You can create more complex computed sorts using the Sort dialog.

When sorted as shown in the above Sort dialog, the products are sorted on quantity.

Manual Sorts
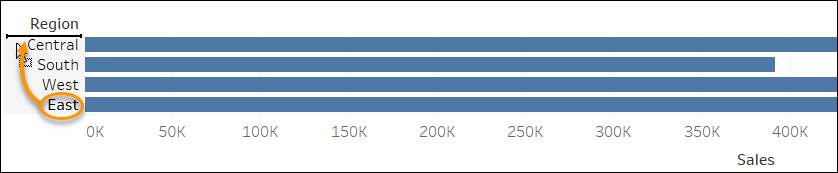
A manual sort organizes the data in a fixed order, for example, to show a particular region's sales first. Manual sorts are an easy way to sort data quickly, but they are not dynamic. Manual sorts are maintained even when the data changes. For example, the sales for the manually sorted region will still be shown in the order specified, even if you add new regions.
Manual Sort Using Drag and Drop
You can do a manual sort by dragging the selected headers or labels to reorder them.
Manual Sort Using the Sort Dialog
Manual sorts can also be created using the Sort dialog.

You learned how to sort data in a view using computed and manual sorts. Now it’s your turn to sort the data in the views you have created for your company data.
Sort Data
Your manager has additional questions on your view. She wants to know which products have the most sales within a category and which products are most profitable. In the past, products in the Technology category have had lower sales compared to other products. So, she is most interested in seeing data for that category of products.
Sort by Fields in a View
You have created a view that shows the sales for product subcategories, separated by category.
- Launch the Trailhead Simulator.
- Click Sort by Fields in a View.
- Click Begin.
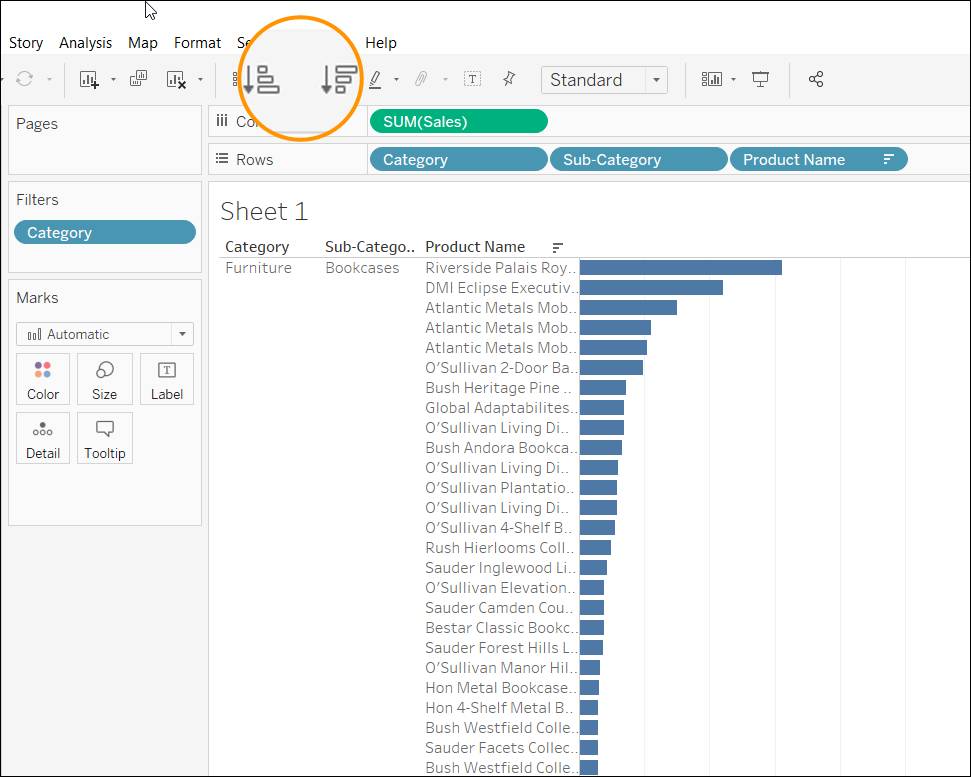
- Right now, the categories and subcategories of products are sorted alphabetically, but you want to see them in a different order that you define manually, with Technology listed first, then Furniture, and then Office Supplies. In the view, drag the Technology header, and drop it above Furniture.
- Next, you want to order the subcategories from highest to lowest based on sales. On the Sales axis, click the Sort icon
 . (You can toggle between an ascending and descending sort by clicking the Sort icon). You now have a view of all products sorted from highest to lowest sales within each category of the product based on sales. The view should look like the following:
- Click Next Exercise to continue to the next exercise.
Sort by Fields Not in a View
You have a view that shows product categories and subcategories, with subcategories sorted by sales. Now you want to investigate how profitable the subcategories are by modifying the existing sort so that the view is sorted by profit. To make the view easier for your manager and coworkers to understand, you should also color encode the bars by profit.
- Make sure that you are in the Sort by Fields not in a View simulation, If you are not there yet, launch the Trailhead Simulator, and click Sort by Fields not in a View.
- Click Begin.
- On Rows, right-click Sub-Category, and then click Sort.
- In the Sort dialog box, under Sort by, leave the selection as Field and click the Field Name dropdown.
- Select Profit from the dropdown list.
- Leave the aggregation as Sum and close the Sort dialog. The view now shows items sorted by their profitability. Copiers is at the top of the list. Despite its lower sales, it is highly profitable. We can confirm this by bringing Profit to the view and showing it in color.
- From Measures, drag Profit to Color on the Marks card.

- Click Home to restart the activity or Exit to continue.
In this module, you learned how to use filters and the various sorting techniques in Tableau Desktop to narrow down and arrange the data to quickly find answers to your questions. You are now ready to share your findings with your manager and the rest of the team.