Filter Your Data
Lesson Objectives
After completing this unit, you'll be able to:
- Apply filters to your data.
- Change filtering options to interact with your data.
- Filter data with date fields.
What Is Data Filtering?
Before you continue with this module, make sure you complete Data Connection with Tableau Desktop and Data Analysis with Tableau Desktop modules. The work you do here builds on the concepts you learn in those modules.
In the Data Analysis with Tableau Desktop module, you created a view of product sales broken down by category and subcategory. That’s a great start, but that is a lot of data to comb through. You need to find the most interesting data points and focus on the insights they drive. Well, Tableau Desktop can help you with that.
Filters allow you to narrow down the data and focus on the details that interest you. After you add filters to your data, you can begin to use other Tableau Desktop features to interact with that data.
You can use filters for any dimension or measure in your data. A dimension in Tableau is a field that contains qualitative, categorical information such as text and dates. Measures are fields that contain numbers, which can be aggregated.
You can also create custom filters on dimensions or measures. After you create a filter, all filtered fields display on the Filters shelf in the worksheet.
We will walk you through filters and how they work. As an option, you can follow along using the Superstore data source found in the Tableau Desktop free trial. We won’t test you on it, but it can help illustrate the experience we talk about here. Note, the free trial can take a few minutes to download and only lasts for a limited number of days.
Filter on a Dimension
Tableau allows you to create dimension filters to view the data values for a smaller set of dimension members. For example, let’s say you are viewing the Sales data for individual customers, but you want to narrow down the data and focus on select customers. You decide to eliminate customers that have names starting with D and S. This type of a filter is an example of a dimension filter.
To create a dimension filter, you drag the dimension to the Filters shelf, which opens up the Filter dialog box. The Filter dialog box for dimensions has several filter option tabs.
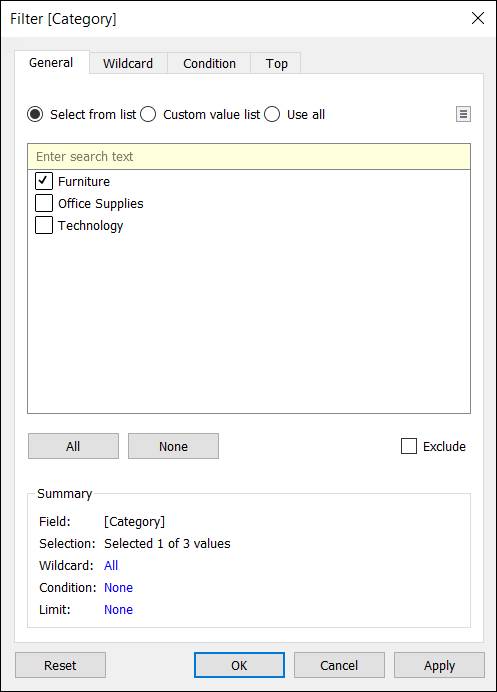
|
Filter option |
Description |
|---|---|
|
General |
Displays the members within each dimension, which you can select for inclusion or exclusion. |
|
Wildcard |
Sets up a wildcard inclusion or exclusion of members matching the value entered. |
|
Condition |
Filters values based on specific conditions. Can be determined by fields, range of values, or formula. |
|
Top |
Filters by top N, where N is determined by the value of specified fields or by formula. For example, top 10 Cities by Profit. This tab can also be used to show only the bottom N. |
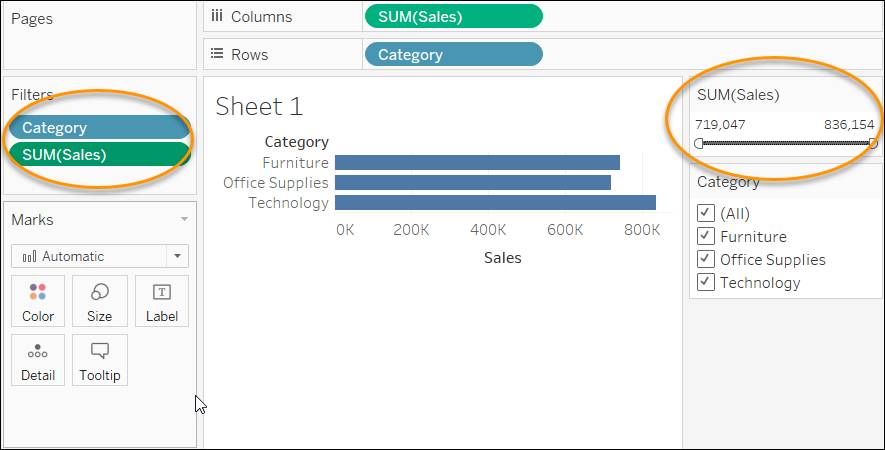
Here is a view with a dimension filter (Category).
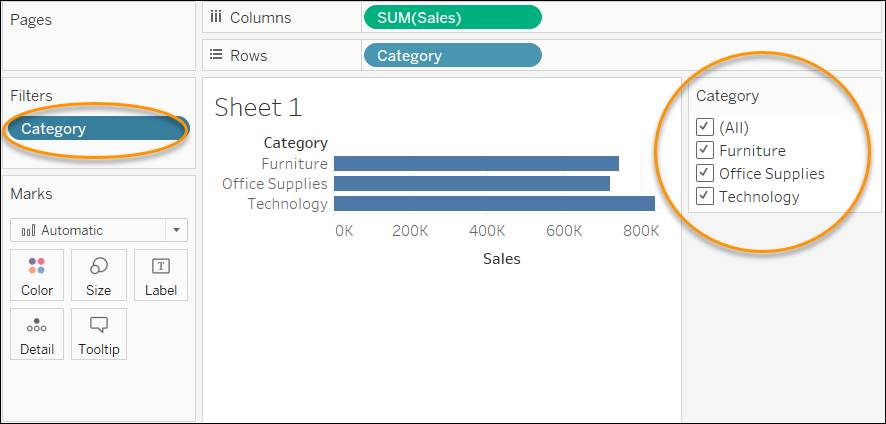
These filters are cumulative, meaning the settings you choose on each tab affect the others using "AND" logic. For example, if you filter the Region dimension to include only West (on the General tab), and then add conditions for a Top 10 filter (on the Top tab), you see Top-10 data for the West only as shown here.

Filter on a Measure
Use measure filters to show only the values that meet your filter criteria. For example, you could apply a filter for Sales that displays only the values above, below, or within a specified range, such as sales greater than $500,000, sales less than $500,000, or sales between $500,000 and $2,000,000.
To create a measure filter, you drag a measure to the Filters shelf, which opens the Filters Field dialog box.
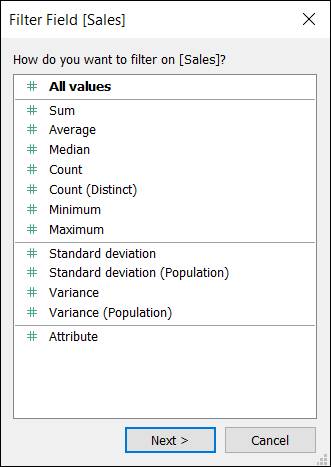
In the Filter dialog box, you can specify the filter criteria as shown in the following dialog.
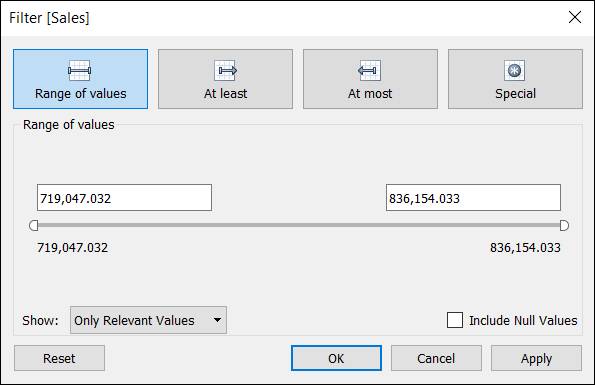
|
Filter option |
Description |
|---|---|
|
Range of values |
Include all values within the specified range. |
|
At least |
Include all values above a specified value. |
|
At most |
Include all values below a specified value. |
|
Special |
Set filter for null or non-null values. |
Let’s see the use of filters in action. Watch the video below to learn how to create and use filters with our Sample Superstore example.
Customize the Appearance of a Filter in the View
By now you know that Tableau Desktop allows you to use filters to narrow down the data you are working with. But that’s not all. Tableau allows you to customize these filters further to make them appropriate for the type of view you are creating. For example, when you want to see data for one dimension member at a time, a single value list is a great option. When you need to compare or combine different members of a dimension, a multiple value list is helpful.
You can control the appearance and interaction of your filter card in the view by selecting a filter-card mode. On the filter in the view, you can edit the appearance and function of the filter as required.
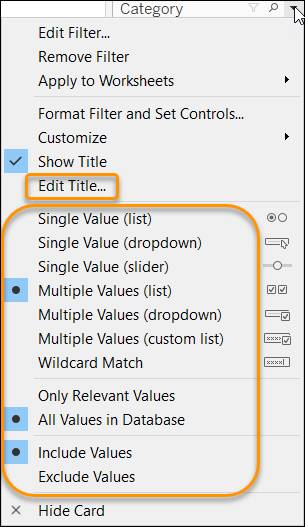
The options available will depend on whether the filtered field is a dimension or a measure. You can also use this context menu to edit the title of the filter. For more information on the types of filter modes for dimension and measure filters, see the filter modes section.
You can modify the filter functionality further with the Customize menu.

By using custom filters to narrow down your data to show only what your manager is looking for, you are one step closer to finding the answers that she is looking for. Let’s try it out.
Filter Your Company Data
You know how to create dimension and measure filters, and how to use these filters to limit the data you show in a view so you can examine or display only the data that you or others want to see. Now you’re ready to create filters in our Trailhead simulator.
For the best experience, view the Trailhead Simulator on a computer, not a mobile device. As a reminder, Trailhead Simulator is different from a Trailhead Playground. The simulator doesn’t store your progress or any data you enter. If you close your browser, you start from the beginning of the simulation again. You can always use the navigation controls at the bottom of the simulator to get back to where you left off.
![]()
|
Navigation Controls |
Description |
|---|---|
|
(1) Left Arrow |
Go backward in the simulator. |
|
(2) Right Arrow |
Go forward in the simulator. |
|
(3) Scrub Bar |
View your progress, plus you can use the progress arrow to quickly move to a different location within the simulator. |
|
(4) Close Button |
Exit the simulator. Remember that if you close the simulator, you start from the beginning the next time you launch it. |
Also note that not everything is clickable in the simulator, just the steps that are laid out here.
When you click in the wrong spot, highlighting shows you where to click.
Now you’re ready to practice what you’ve learned and filter the data in your company data source.
Filter on a Dimension
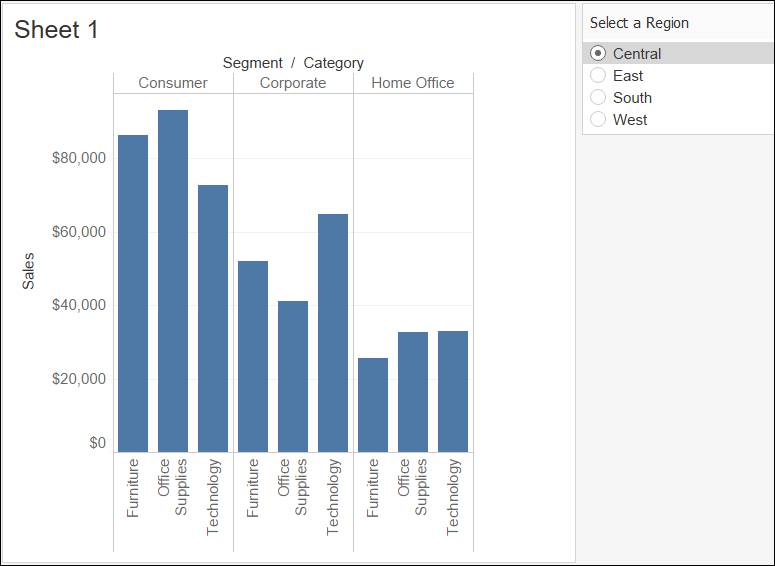
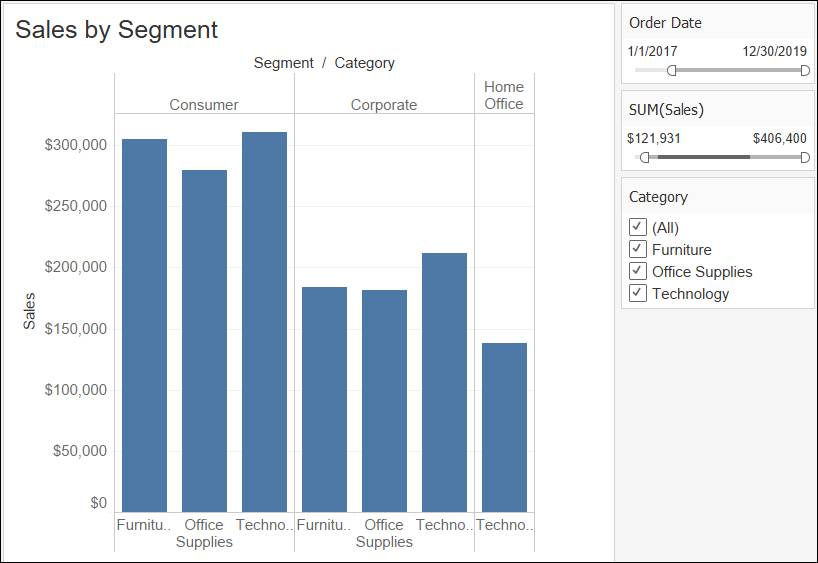
Your manager wants to see total Sales data for individual regions. You have created a view that shows sales for all categories of product in each consumer segment, shown here.

Because your manager wants to see data for each Region, you need to create a quick filter for Region, as a single value list, and title it Select a Region.
- Launch the Trailhead Simulator.
- Click Filter on a Dimension.
- Click Begin.
- On the Data pane, right-click Region, and click Show Filter.
- On the quick filter (Region filter on the right), click the dropdown arrow, and select Single Value (List).
- Click the dropdown arrow again on the quick filter menu, select Customize, and click Show “All” Value to clear the check box.
- Display the quick filter menu again, click Edit Title and change the title of the filter to
Select a Region. - Press enter or return and click OK. You have now created a quick filter to show data for each region.
- Click Next Exercise to continue to the next exercise.
Filter on a Measure
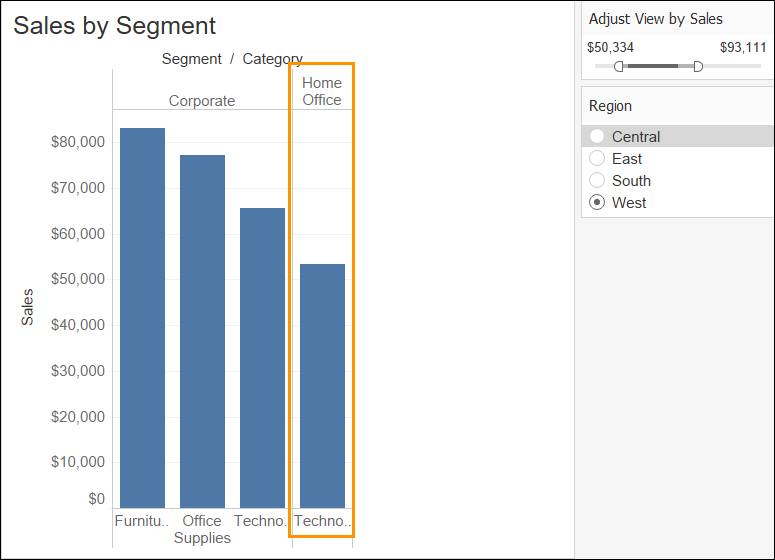
Your manager is particularly concerned about sales in the Central and West regions, and wants to know which products have sales lower than 50,000. You decide it will help to add an additional filter on Sales. Create a quick filter for the sum of Sales and title it Adjust View by Sales.
- Make sure that you are in the Filter on a Measure simulation. If you are not there yet, launch the Trailhead Simulator, and click Filter on a Measure.
- Click Begin.
- From the Data pane, drag Sales to the Filters shelf.
- In the Filter Field dialog box, click Sum, click Next.
- Click OK.
- Click the dropdown arrow for the SUM(Sales) filter in the Filters shelf, and select Show Filter.
- Click the dropdown arrow for the SUM(Sales) quick filter, and click Edit Title.
- Name the quick filter
Adjust View by Salesand press enter. - Click OK to close the dialog box.
- You can use the slider to filter on products that have sales above 50,000. Click the slider. Notice that Office Supplies is not in the view anymore for the Corporate segment indicating sales lower than 50,000.

- Next check the West region. In the Region quick filter, select West. Notice that both Office Supplies and Furniture have low sales in the Home Office segment of the West region.
You created filters on dimensions and measures. But what if you want to show data for specific years, months, or dates?
Filter on Dates
Tableau also allows you to filter on dates. You can use a date filter to filter a data subset for specific date or time criteria. You can also filter dates for a specific range of dates or for a discrete date/time.
To add a date filter, you drag a date field to the Filters shelf, which opens the Filter Field dialog box. In the Filter Field dialog box, you can specify the type of date filter you want to use, such as Relative Date, Range of Dates, and Start and End Date filters.
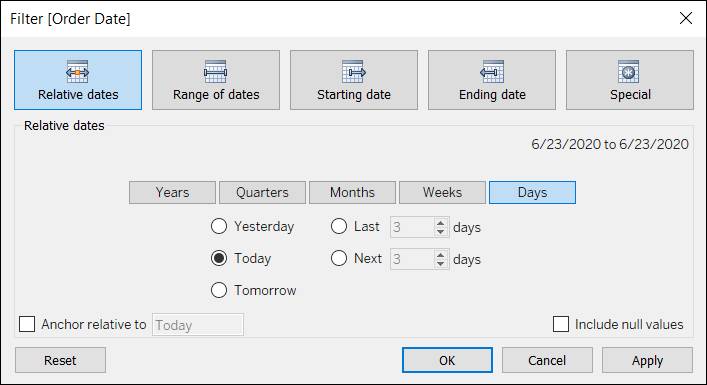
Relative Date Filter
Use the Relative Date filter to update data dynamically with time. For example, set your filter to show data for three months before or after the current date. The data shown in your view updates daily.
Range of Dates Filter
Use the Range of Dates filter to specify a span of time. You can also specify a starting or ending date.
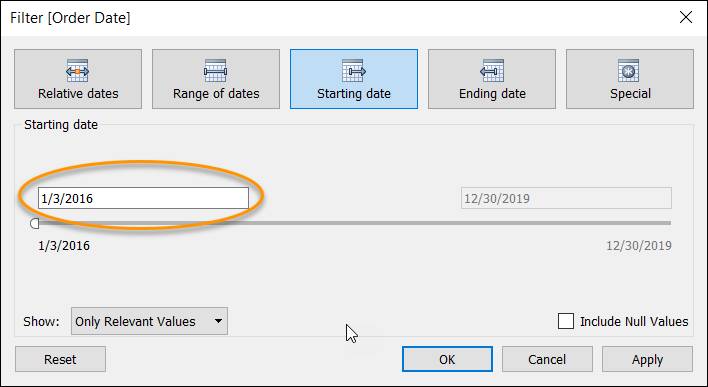
Starting Date or Ending Date Filter
You can create date filters that have specific start and end dates.
Now that you are now familiar with the types of date filters you can create in Tableau, let’s create one.
Create Date Filters for Your Company Data
You have the views and the filters set as per your needs. But you only want to see sales data for orders starting from 2017. You create a Start Date filter to display orders starting from January 2017.
- Launch the Trailhead Simulator.
- Click Filter on a Date.
- Click Begin.
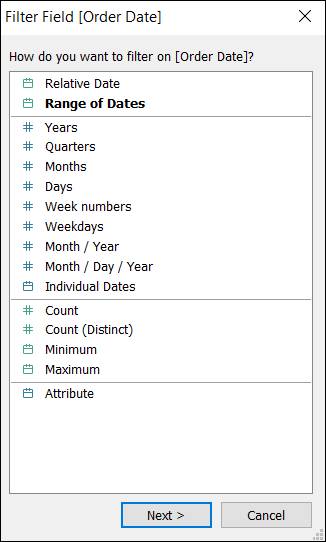
- From the Data pane, drag Order Date to the Filters shelf.
- In the Filter Field dialog box, Range of Dates is selected. Click Next.
- Click the start date field.
- From the calendar, select 1/1/2017, and then click OK.
- Click the dropdown arrow for the Order Date field in the Filters shelf.
- Click Show Filter. The Order Date filter appears to the right of the view. Now you can adjust your view to show sales for the desired dates.
- Click Home to restart the activity or Exit to continue with the unit.
Congratulations! In this unit, you created filters to show sales data for all your inventory. You share the views with your manager, but she has additional questions, such as:
- Which subcategory of a product within a product type has the maximum sales?
- Which bookcase has the most sales?
- What are the top-three best-selling products?
You can find answers to these questions by sorting this data. Continue to the next unit to learn how to sort data using Tableau Desktop.