Learn How We Calculate the Score
Learning Objectives
After completing this unit, you’ll be able to:
- Explain how the three key Customer Success Score categories are weighted.
- Interpret your score and pinpoint areas for improvement.
How the Categories Contribute to Your Score
You’ve learned that the Salesforce Customer Success Score helps you assess and improve your organization's utilization of the Salesforce Platform. You’ve also learned that the score is calculated based on three key categories: Product Adoption, Customer Expertise, and Technical Health.
Each category contributes to a holistic view of your Salesforce success and identifies potential areas for optimization. Let’s take a closer look.
1. Product Adoption: This category measures the extent to which your organization uses Salesforce licenses, credits, and features. It assesses the active use of the platform's capabilities and helps determine if you're maximizing your usage. Tracking usage patterns within this category can reveal opportunities to implement underutilized features.
2. Customer Expertise: This category evaluates your team's engagement with Salesforce resources and their proficiency in using the platform. It considers factors such as usage of features in the Signature Success Plan plan and relevant certifications. A strong Customer Expertise score indicates a commitment to continuous learning and maximizing the potential of Salesforce.
3. Technical Health: This category focuses on the operational efficiency and stability of your Salesforce environment. It examines factors such as security, customization, efficiency, observability and operational excellence, monitoring the overall health of your implementation. Maintaining a high Technical Health score ensures a smooth and reliable user experience, minimizing disruptions and maximizing productivity.
The overall Customer Success Score is a weighted composite of these three categories. Typically, Product Adoption constitutes 50% of the total score, Customer Expertise 20%, and Technical Health 30%. However, if Technical Health data isn't currently available for a tenant, the weighting is adjusted to 70% for Product Adoption and 30% for Customer Expertise.
We refresh the data used to calculate your Customer Success Score monthly to provide you with up-to-date insights that can inform your Salesforce strategy and foster continuous improvement.
Color-Coded Score Bands
Each score, whether for an individual metric (signal) or your overall score, is categorized and visually represented by a color-coded band. This helps you quickly identify areas that require attention.
-
Fair (red): Scores ranging from 0 to 30 indicate that the area needs improvement.
-
Good (yellow): Scores between 31 and 60 suggest that the area is performing adequately but could benefit from further optimization.
-
Excellent (green): Scores from 61 to 100 represent strong performance in the given area.

[ALT TEXT: A Customer Success Score with Product Adoption highlighted.]
Meet Ursa Major Solar
Ursa Major Solar, Inc., is Southwest-based supplier of solar components and systems. Maria Jimenez is the admin responsible for managing the company’s Salesforce environment. With the recent onboarding of new solar service representatives, Maria has been monitoring their Salesforce usage. She reviews Ursa Major’s Customer Success Score summary and notices a decline in the company’s overall Product Engagement score under the Product Adoption (1) category. She wants to identify appropriate next steps.
Recognizing the need for more granular data, Maria begins her investigation by drilling down into the Product Adoption category.

[ALT TEXT: Screenshot of the Customer Score Trends, highlighting Product Engagement.]
When Maria selects the category, she can view the detail page and see the Subcategory score, trendline, and signal groups, and the products being used.
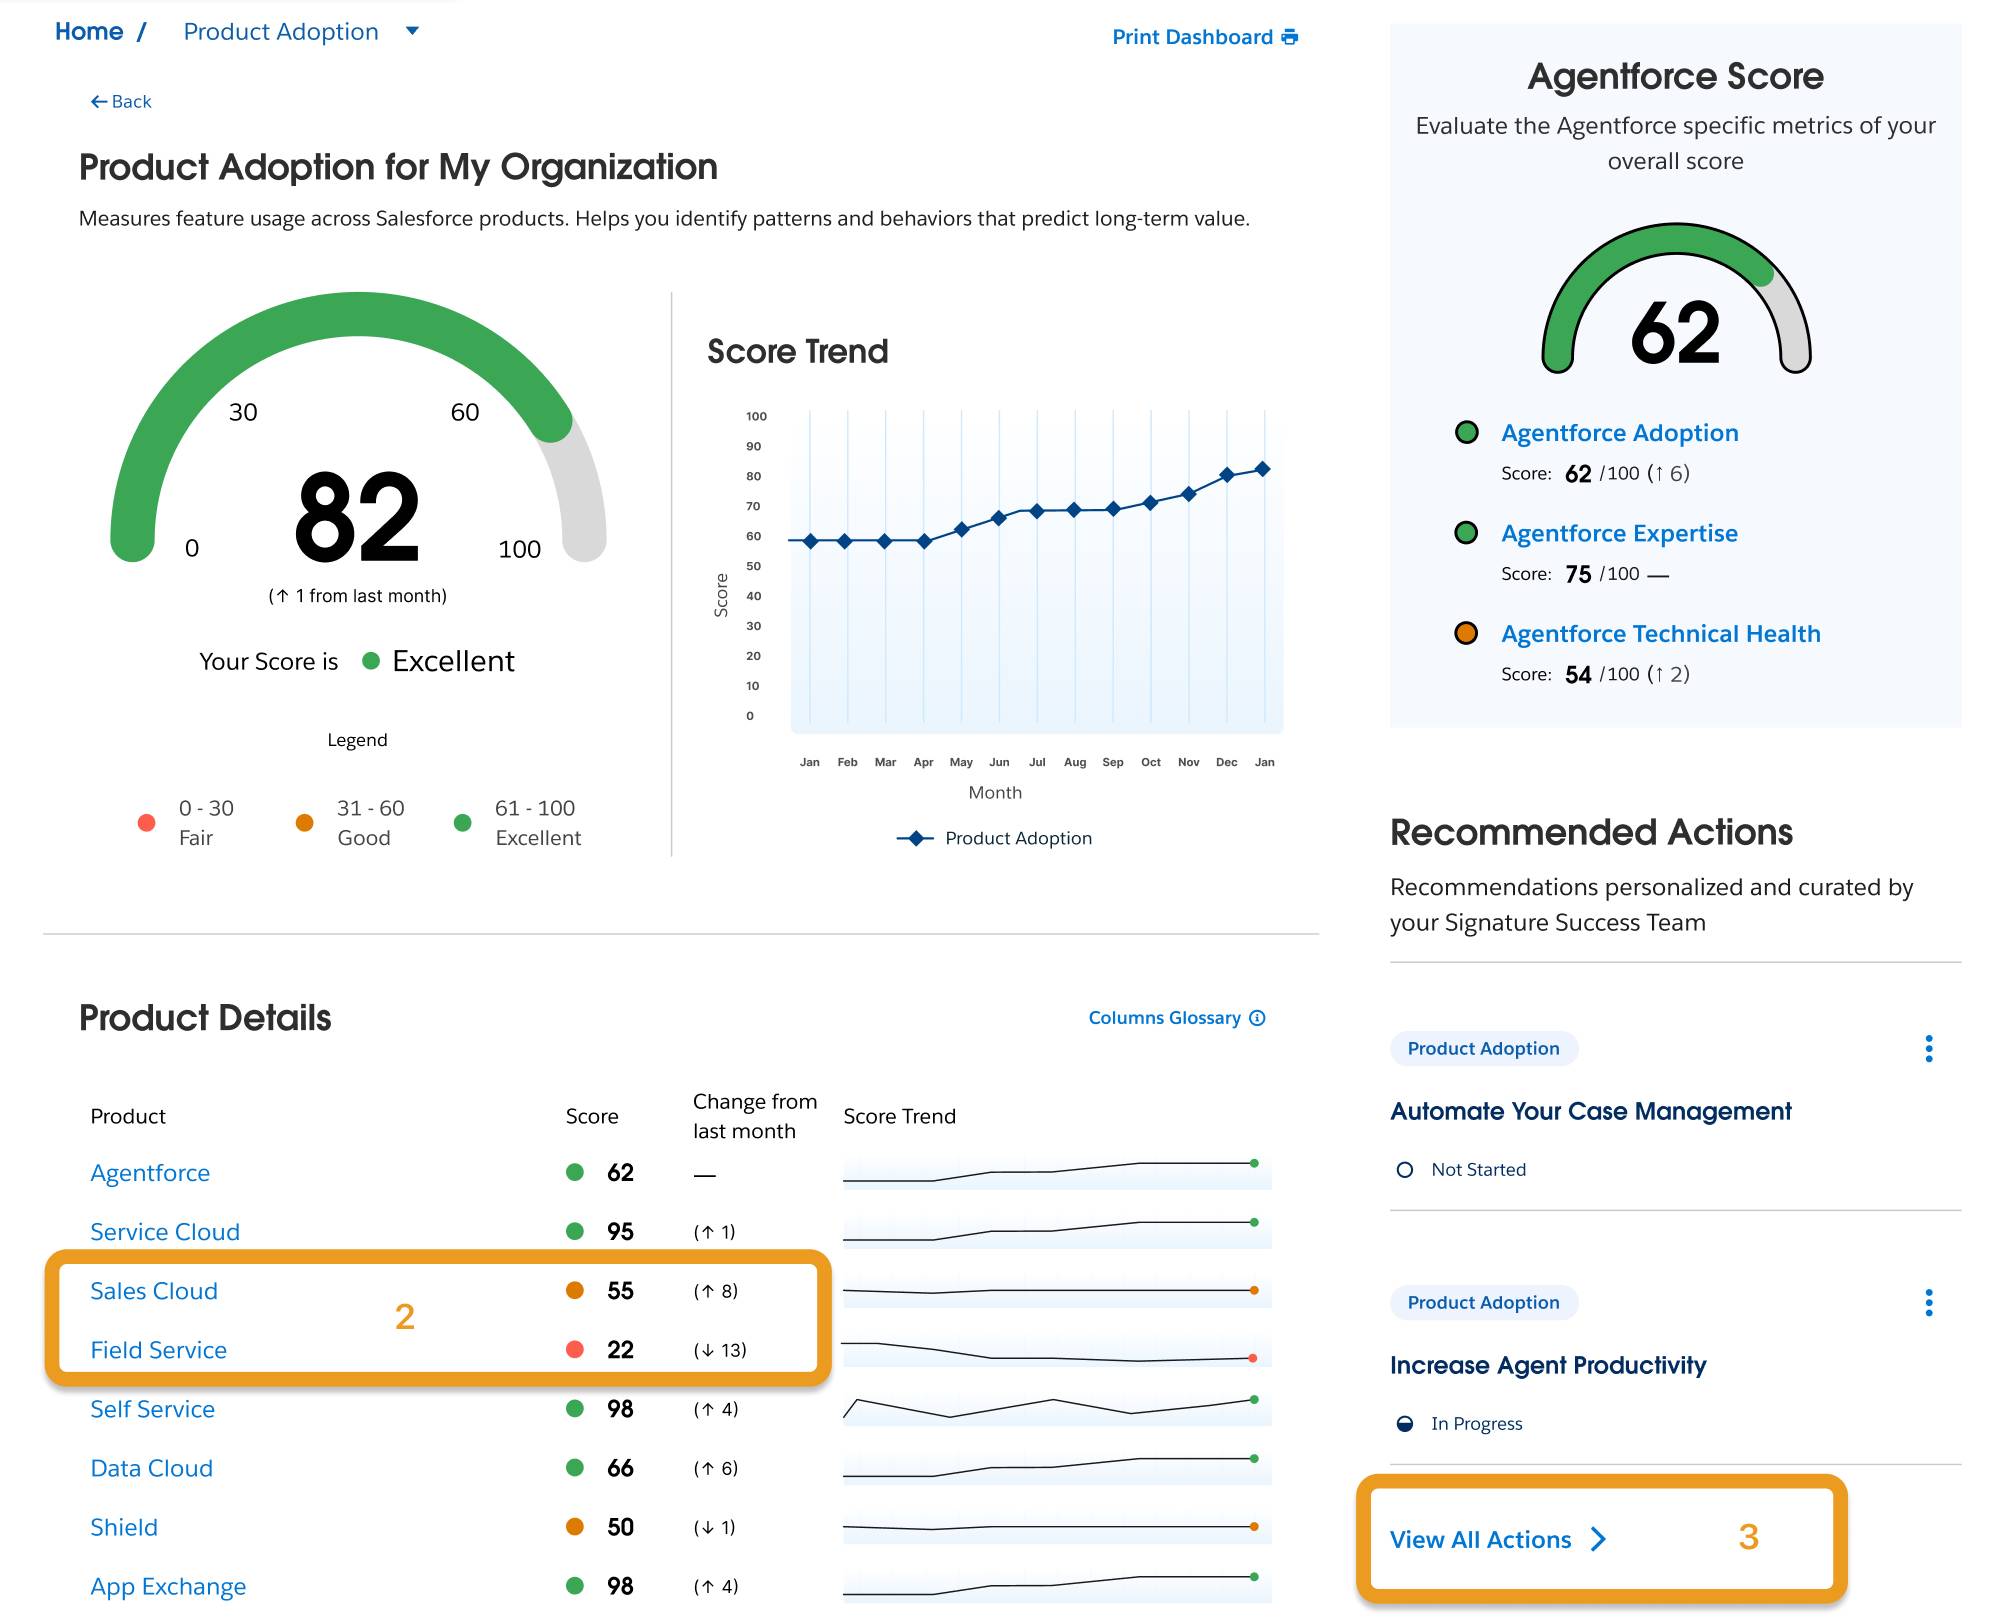
She observes low usage in both the Sales Cloud and Field Service (2). From the same details page, she has the option to explore other categories, but for now, she has sufficient information to proceed. Maria now seeks recommendations related to improving Field Service use and promoting internal adoption of the Sales Cloud product. The Customer Success Score can help her with recommendations, too.
She clicks View All Actions (3) in the Recommended Actions section to see a tailored list of actionable recommendations. She identifies several promising options and selects one as her next step: creating a report to enable service leaders to monitor and reinforce the practice of logging opportunities and work orders while in the field. With a long-term focus on improving rep productivity, Maria adds other relevant recommendations to her favorites for future consideration directly from the Recommended Actions page.

Trending Signals
To track improvement, Maria plans to use the Trending Signals section of the Customer Success Score dashboard. This gives her a quick overview of key performance changes from the previous month. This section highlights the signals that have shown the most significant upward or downward movement, allowing her to easily identify areas of impact and potential opportunities for ongoing improvement.

Bring It All Together
Let's take a look at all of this together. Use the interactivity to see examples of how each category is composed of the individual signal scores that together calculate the overall Customer Success Score for your organization.
Let’s Recap
You took a closer look at how the Customer Success Score evaluates your success and areas for improvement in Salesforce across three key categories: Product Adoption, Customer Expertise, and Technical Health. You also explored how it provides personalized recommendations and regular updates to help you enhance your Salesforce usage. Next, learn how to improve your score.