Personalize Your CRM Analytics
Learning Objectives
- Set up, view, and manage notifications from dashboards.
- Follow a dashboard.
Follow Along with Trail Together
Want to follow along with an expert as you work through this step? Take a look at this video, part of the Trail Together series.
(This clip starts at the 6:58 minute mark, in case you want to rewind and watch the beginning of the step again.)
Let’s Get Personal
CRM Analytics can notify you about key performance indicator changes right on the CRM Analytics home page. Using notifications, you set up CRM Analytics to tell you when a milestone is reached. The CRM Analytics notifications also appear in Lightning Experience and in your email.
Another way to personalize your analytics is to follow dashboards. That’s right, you can get the latest about a dashboard in your Chatter feed, just as you would when following someone on social media. Then you can be in the loop on conversations about the dashboard and the data displayed in its charts.
Stay on Top of Your Business with CRM Analytics Notifications
How do you get this essential information to flow to you? Simply set up notifications on your CRM Analytics dashboards. Remember that you wanted to keep an eye on the Open Pipeline KPI? This KPI is actually a number widget in your dashboard. You can create notifications on any widget in your dashboard (except for timelines and values tables).
- Go back to the home page by clicking the small, blue Home link above the lens title.
- Open the Opportunity Details dashboard. If it’s still filtered for Johnny Green, click
 .
. - Hover at the upper-right corner of the Open Pipeline number widget, and click the arrow to drop down the menu. Select Set Notification to open the notifications panel.
 You set the condition and value to test against your data. For open pipeline, you want to know when the amount is at or more than 200 million.
 - In the notifications panel, select Equals or is greater than from the second dropdown menu. Enter
200000000as the threshold value. Note the criteria for your query in the middle section of the panel. “Closed is false” is a filter applied to limit the data that’s queried. The Open Pipeline widget requires the “closed equals false” filter by definition.
You don’t need to make any changes now. But to apply different filters, simply change the dashboard by using the list selectors or clicking chart elements, as you learned in the last unit. Any additional filtering is listed in the Filters section of the Notifications panel.
Next, tell CRM Analytics when to notify you by setting the time when CRM Analytics runs the query against your data. Your admin suggested that 5:00 AM is the best time for CRM Analytics to run notification queries, after the daily CRM Analytics dataflow completes each night. (For your individual notifications, the timing may not matter much, but each CRM Analytics user in your org can set up to ten notifications. That could mean many queries running at once, in addition to all the other calls on the system. It’s a good idea to check with your admin about the timing.)
- Set the notification to run at 5:00 AM on Every Weekday.
- Note for future reference, if you wanted colleagues to automatically receive your email notifications, you could click Edit Recipients and add users who have access to the dashboard. For now, you can leave the default where you’re the only recipient.
- Click the pencil icon and change the title of the notification to
Open Pipeline Test. - Click Save and Run.
Put the CRM Analytics Home Page to Work for You
- Click the small, blue Home link above the dashboard title.
- Click Notifications in the left panel.
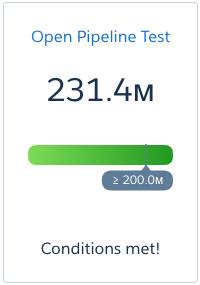 Because you’ve set a notification, you have a notification tile on your home page! The tile shows the current value of the KPI and your progress toward the set conditions.
 - From the tile, you can go directly to the dashboard. Click Open Pipeline Test. The dashboard opens showing the notification in the panel on the right, and the notification’s widget is identified with a number in a blue square.

- You can also access the notifications panel from the icon controls. Go ahead and click
 to close the notification panel. Then click again to reopen it.
In this view, you see each notification summarized on a tile.
- From the notifications panel, you can edit or delete notifications. Hover at the upper-right corner of the Open Pipeline Test notification tile, and click the arrow to drop down the menu. Select Edit.
When the panel is in edit mode, you can access additional options. Track on Analytics home page lets you set whether the notification appears on your CRM Analytics home page. Active lets you control whether CRM Analytics runs your query and sends notifications. You don’t have to delete a notification in order to stop it from running; you can save it for another time when you want to activate it. When it comes to your test notification, you don’t need to get email about it every day, so you want to deactivate the notification.
 - Click to remove the check from the Active checkbox. Note that inactive notifications are not tracked on the CRM Analytics home page.
- Click Save.
Follow That Dashboard
- Click
 to open the annotations panel.
 - Click
 .
.
You’ve Got Notifications!
- Click
 to move to the Analytics Studio.
 - Click the bell icon
 in the upper row of controls.
- From the menu, you can click a notification to go to the dashboard where the notification is set. But for now, select Manage Analytics Notifications.
 From this view, you can see all your active and inactive notifications across all dashboards. This is also where you can keep track of how many notifications you’ve created. Remember, each CRM Analytics user can have up to ten notifications at a time.
 - Click the X to close the Manage Analytics Notifications panel.
Many Signposts and Trail Markers through Your Data
And now that you’re following the top-level dashboard in your app, you’re ready to collaborate with your sales reps.
But first, take the hands-on challenge, create a new notification, and get your points!
