Understand How Templates Work
Learning Objectives
If Apps Are Houses, Templates Are Blueprints
Before getting into the details of template development, a bit of architecture to help you understand how apps and templates are related.
You know how a house plan works, right? An architect draws one up, then builders use the same basic plan for several houses, each with its own specific features to suit the buyer. Each house follows the same basic plan, but one combines the kitchen and family room. Or another has extra closets or a larger bathroom. Another has larger windows and more doors. And each of them uses slightly different finishing materials—shingles, stucco, clapboard, brick, or wood panels.
That’s the way templates work, too. A development team starts by creating an app—a collection of Analytics datasets, dashboards, lenses, and recipes or dataflows.

They create a template from the app using Analytics Templates, and the template becomes a blueprint for the app. The “plan” for the app is expressed in the form of a template object, which is made up of several JSON files.
Other organizations can then use that blueprint to create their own versions of the app. But they can create the app using data from their Salesforce org according to their own analytics needs. They might want to add Salesforce objects or use custom security settings. Or filter customer data based on different fields or terminology. Or create fewer or more dashboards.
Salesforce has created a wide variety of templates. We started with broad, general-purpose templates that create the Sales and Service Analytics apps. More recently, we’ve added templates for apps with more focused purposes, such as Campaign, Change, Retail Banking, and Health Cloud Analytics.
Each template is based on an app with datasets, dashboards, and lenses created by the CRM Analytics development team. You use our templates to create your own versions of the apps to analyze Salesforce data. If you’ve spent any time working with CRM Analytics, perhaps you’ve created your own apps and your teams are using them as we speak.
One other point about templates: They’re more useful for apps that analyze data from Salesforce. You can create templates for apps that use non-Salesforce data. But they’re much more complex and require more work to get the non-Salesforce data into CRM Analytics. For the purposes of this module, we’re going to use an app that includes only Salesforce data.
Anatomy of a Template
You and your analytics team just shed blood, sweat, and tears creating the Execs Only app. With CRM Analytics Templates, you create a template based on the app to save others the trouble you just went through. Creating a template is just part of the process on the way to distributing your app. We don’t show how to create a template here. To jump-start the learning process, we’ve created the templates used for the examples in this module. They’re in the download file we mentioned in the Resources section of the previous unit.

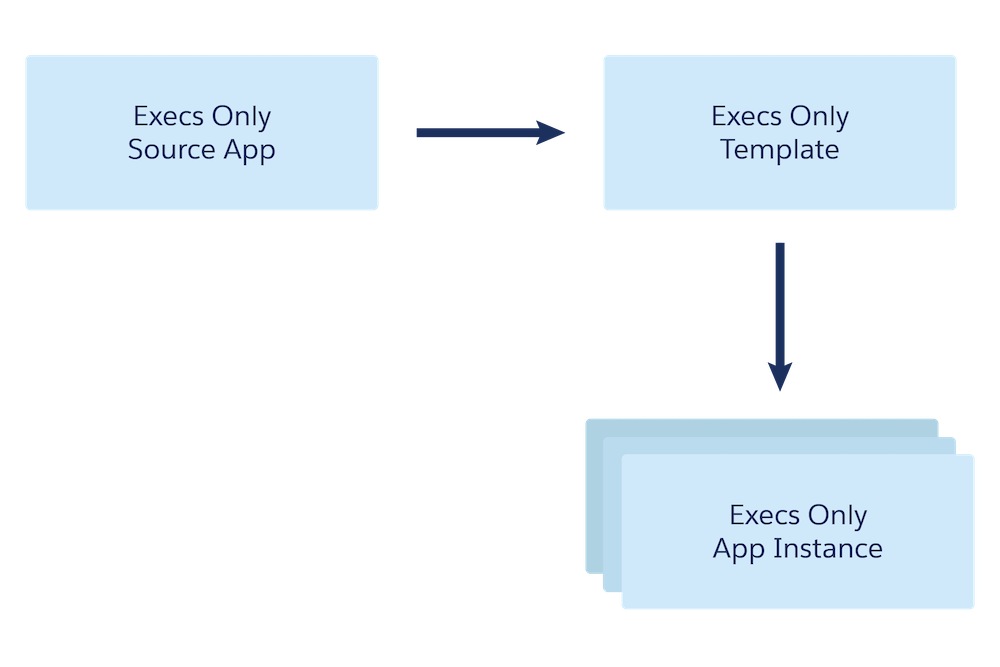
The original app you create is known as the “source app” for the purposes of creating a template. Our source app is the Execs Only app that the DTC CEO is so crazy about. We’ve used that app for all the examples that follow.
As shown here, you can create one template from each source app. Others can then use the template to create multiple instances of the app. (Just in case you were curious, you can’t create a new template based on an app created from a template.)
One Template, Many App Variations
Templates can include configuration wizards—optional but highly useful additions that let admins customize the app. Wizards guide you through the creation of the app, asking you questions about how you store data in your Salesforce org and how you’d like to view the data in your app. You make selections that determine how the app you create modifies the original. Many of the Salesforce templates, for example Sales Analytics, include wizards. It’s likely that every customer creates a slightly or significantly different version of Sales Analytics. But every Sales Analytics customer starts with the same app template.
It’s also likely that you want to let partners use a wizard to set up the Execs Only app to meet their specific CRM Analytics needs. To do that, you modify the JSON files that define the template. The JSON files open a world of flexibility and power in the template creation universe. They contain the instructions the CRM Analytics platform uses to create the app. When you create the Sales Analytics app, CRM Analytics looks at the JSON files’ contents, including your wizard selections. It follows instructions in the JSON to create the app.
You’ll get to know a lot more about the JSON files in the next units. (And if you want to skip ahead, complete details about them and template development can be found in CRM Analytics Templates Developer Guide. See the Resources section.) Along the way, we give you examples of how to edit the JSON to create your own templates. You won’t create them yourselves for now—that’s for another day. Toward those ends—and to speed things up—we’ve cheated a little and created a template based on the DTC Execs Only app. Our template creates an app with just the Sales and Pipeline Performance dashboards.
Let’s see how that works!
Create the App from a Basic Template
Log in to the special Developer Edition org you set up in the last unit, and select Analytics Studio from the app picker.
You’re ready to create the Execs Only app from the template.
- Click Create and select App.

- Look at all the CRM Analytics templates you can choose from! Scroll through the list until you find Execs Only Template 1, select it, and click Continue. Be sure to select Template 1.
- Click Continue until you get to a screen where you can name your app. Enter the name Exec App 1 and click Create. That brings up the app creation progress screen. It shows you what CRM Analytics does behind the scenes while it creates the app.
While waiting for your app to be created (it takes a minute or two—not instantaneous, but a lot quicker than developing your own app!), a brief aside: You probably noticed that Execs Only Part 1 doesn’t have a wizard. That’s because we haven’t added the necessary code to the JSON files to add questions, variables, and so on. We’ll show you how to edit the JSON to add a wizard in the next unit.
Also, normally you wouldn’t have two versions of a template in an org. We’ve provided two versions of the Execs Only app template to demonstrate the power of templates. You’ll see what Execs Only Template 2 does in a later unit.
The Basic Execs Only App
When you see the message Application Complete at the end of the app creation steps, refresh the page to get to the app. You’ll see something like this:
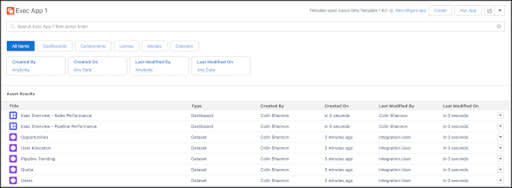
Your basic version of Execs Only has two dashboards and several datasets. Click Run App at the upper right. Now you can see just what the DTC CEO and your partners fell in love with. The dashboard widgets at the top, Pipeline Performance and Sales Performance, give a high-level view of how DTC sales are going for the selected period. Further down, lots of detail. And all in a single, scrollable view. Nice!
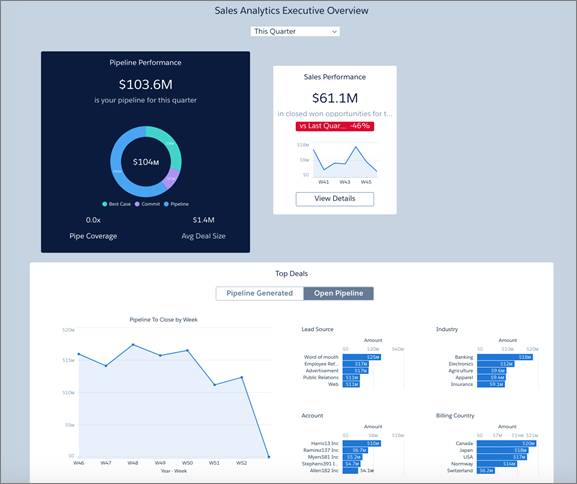
To see how the dashboard works, change the date filter at the top from This Quarter to This Year. Then click the Pipeline Generated side of the toggle below Top Deals. The widgets refresh themselves based on your selection. You can see why people like this so much—lots of analysis in a couple of visualizations, easy to get different views of it. Cool!
In the next units, we’re going to look closely at the template files themselves. Then, we’ll make the template—and the app you create from it—more fully functional. We’re going to take our basic template and make a few simple, but powerful changes, adding configuration wizard questions that give DTC partners the power to customize their version of the app.
For now, answer the questions below to continue the quest to earn your badge.
Optional: Refresh CRM Analytics Data with the Trailhead Data Manager
The first part of the process includes refreshing data and then running your app’s dataflow.
- In Analytics Studio, go to the app picker at the upper right and select Trailhead Data Manager. You may have to scroll to find it.
- Click Refresh DTC Data. After the refresh completes, it's time to run the app dataflow.
- Go back to Analytics Studio.
- Click Data Manager. (You’re opening the Data Manager, not to be confused with the Trailhead Data Manager.)
- Click Manage Dataflows.

- Click the Connect tab, then click the dropdown to the right of SFDC_LOCAL, and select Run Now. This action kicks off data sync jobs that pull the latest Salesforce data into CRM Analytics so it can be used by the dataflow. After the syncs are complete, run the dataflow.

- To monitor the sync jobs, click Monitor and click the Jobs subtab. You should see that the syncs are currently running.
- Click the Refresh Jobs button (
 ) until the status changes from Running to Successful for all sync jobs.
 - After all sync jobs are complete, click the Dataflows and Recipes tab in Data Manager. The Dataflows subtab opens by default.
- To the right of the "Exec App 1 eltDataflow" dataflow, click the dropdown and select Run Now. This dataflow populates the datasets with data required by the Exec Only dashboards.
- To monitor the dataflow, click Monitor and click the Dataflows subtab. You should see that the dataflow is currently running.
- Click the Refresh Jobs button until the dataflow's status changes from Running to Successful. (If you see a warning message, ignore it and keep going. It won’t hurt your app’s data.)
- Next, you download and import a CSV file called Quota so that data about quotas appear in your app. You also use the Trailhead Data Manager to do that. Note: In real life, you only have to add quotas data to your app if you store it in a tool outside Salesforce and want to view the data in CRM Analytics. This is sometimes the case for Sales Analytics app customers.
- Go back to the Trailhead Data Manager. Click the app picker to find it.
- Click Download Quota Data, and then click Download Quota CSV. The file ‘DTC_Quota.csv’ downloads to your Downloads directory.
- Open Analytics Studio again, and then click All Items in the left-hand column.
- Click the Apps tab, then open the app you just created. It’s named Exec App 1.
- Click the Datasets tab and locate the Quota dataset.
- Click the dropdown to the right of the Quota dataset and click Edit. If you’re viewing dataset icons, hover over the Quota dataset, click the arrow in the upper right corner, and click Edit.
- At the top of the next screen, locate the Replace Data icon, next to the gear, and click it.

- That takes you to the Replace Dataset Data page. Click Select file or drag file here….
- Find and select the DTC_Quota.csv file and click Next.
- Click Next on the next page, too, then Upload File on the next page.
- Finally, click Replace and Got It. (The last few pages let you fine-tune your data before you upload it into a dataset, but that’s a subject for a different day. If you want to learn more about importing data to CRM Analytics, see the CRM Analytics Data Integration Basics Trailhead module.)
- Finally, rerun the Exec App 1 eltDataflow dataflow to be sure that the quotas data appears in your app. Repeat steps 5 through 7.