Explore Tableau Accelerators for Nonprofits
Learning Objectives
After completing this unit, you’ll be able to:
- Describe how Tableau Accelerators give you a head start on analyzing your data.
- Explain how to find ideas for new visualizations using Tableau Public.
- Discuss how the Salesforce Impact Exchange can help your organization with data analysis.
Jump-Start Data Analysis with Salesforce for Nonprofits and Tableau
Agentforce 360 for Nonprofits is a platform that helps nonprofits unify their fundraising, program management, grantmaking, and marketing data to deliver exceptional stakeholder experiences and drive impact. Connecting Agentforce 360 for Nonprofits products to Tableau gives you the power to easily surface this data for deeper exploration, analysis, and sharing. Together, the two tools create an end-to-end impact platform.
But where do you begin?
Whether you use Agentforce Nonprofit or a managed package solution like Nonprofit Success Pack, there are ways to start quickly and get volunteer help when you need it.
In this unit, learn about Tableau Accelerators, Tableau Public, and Impact Exchange to begin your data analysis, find inspiration, and connect with skilled Tableau volunteers.
Connect Your Data to Tableau Accelerators
Tableau Accelerators are ready-to-use dashboards that you connect to your data. Use them to jump-start your analysis in minutes with actionable data. Think of Accelerators like templates with a predefined structure. In just a few clicks, you can connect your real-world data to an Accelerator to create beautiful, data-rich dashboards. You can then customize these dashboards to get data-driven insights faster. Add and change vizzes to learn more about your operations.
With a better view of your data, you’ll be on your way to raising more money, running more effective programs, and fulfilling your mission.
Many Accelerators are available for Agentforce Nonprofit and Salesforce managed-package solutions like Nonprofit Success Pack. You can even use some Tableau Accelerators with spreadsheets and map them to other data sources.
Find the full library of Tableau Accelerators for nonprofits on Tableau Exchange, the curated marketplace of tools to help you analyze your data in Tableau.
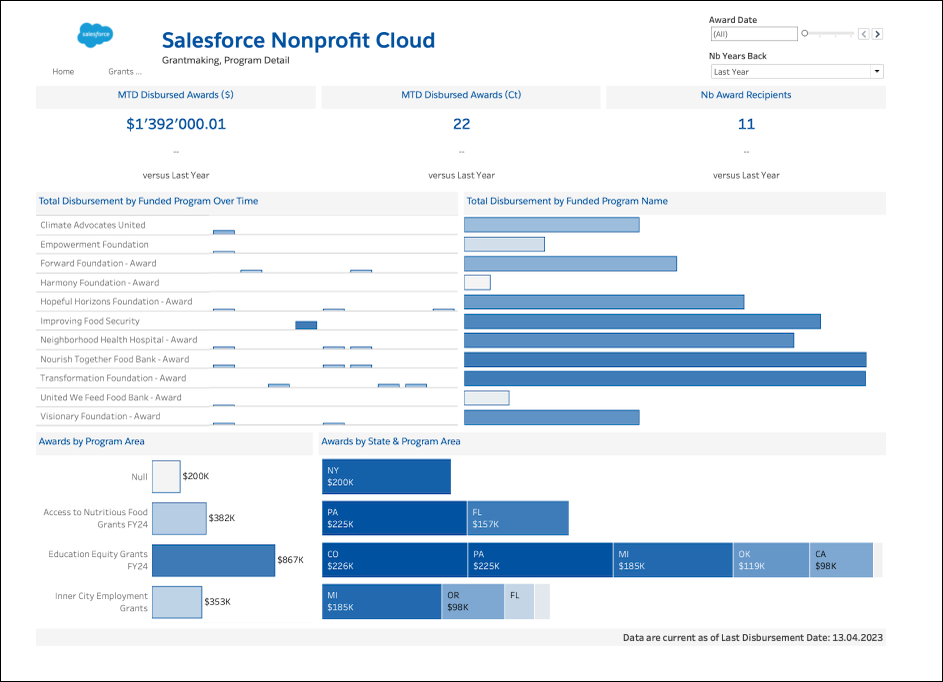
Take, for instance, one Accelerator: Salesforce Nonprofit Cloud - Grantmaking. It quickly connects to Agentforce Nonprofit for Grantmaking, using its data model to generate vizzes that inform a grantmaker’s process. The vizzes show funding trends by program, state, and grantee over time. Another view displays grant-application trends. Plus, the Accelerator provides a deep-dive profile of each grantee to show their total awards and other details.
This screenshot of the Program Detail view in the Salesforce Nonprofit Cloud - Grantmaking Tableau Accelerator includes total disbursements by funded programs over time and other vizzes.
All of these vizzes and dashboards populate immediately when the Accelerator is connected to a Salesforce org that includes Agentforce Nonprofit for Grantmaking. You can then customize the dashboards to fit your needs.
Read Use Accelerators to Quickly Visualize Data in Tableau Desktop and Web Authoring Help for details about how to find Accelerators and connect them to your data.
Get Inspired on Tableau Public
After you start working with a Tableau Accelerator, you may need some inspiration to take your next step.
Fortunately, the Tableau community—called the DataFam—contributes to Tableau Public.
Tableau Public is a free platform for exploring, creating, and publicly sharing vizzes online using public data. With millions of inspiring data visualizations to discover and learn from, Tableau Public makes it easy to develop your own data skills and create an online portfolio of work.
Where to start? Check out the Tableau for Nonprofits profile page on Tableau Public first. Then, earn the Data Storytelling with Tableau Public badge to learn more about Tableau Public.
Find a Data Guide with Impact Exchange
Need more help with Tableau?
Salesforce Impact Exchange can connect you with a network of volunteer Tableau experts eager to help any nonprofit, regardless of size, do more with their data. Whether your organization is getting started with Tableau, is stuck on a specific problem, or wants to upgrade your nonprofit’s visualization skills, you can find a volunteer to help. Visit Impact Exchange for details.
Pairing the power of Agentforce 360 for Nonprofits and Tableau—with some help from Tableau Accelerators, volunteers, and more—empowers your nonprofit to make data-driven decisions to advance your mission. This isn’t just a shift in technology, but a critical shift in culture that can take your organization’s impact to the next level.
Good luck as you get started with Tableau!
Resources
- Tableau Website: Tableau Accelerators
- Tableau Exchange: Accelerators, Nonprofit Category
- Tableau Desktop and Web Authoring Help: Use Accelerators to Quickly Visualize Data
- Tableau Public Website: Tableau for Nonprofits
- Salesforce Website: Impact Exchange