Use the MuleSoft RPA Manager Dashboard
Learning Objectives
After completing this unit, you’ll be able to:
- Use the Dashboard module on MuleSoft RPA Manager.
- Monitor processes using public dashboards.
- Create and publish dashboards.
In unit 1, you learned how to monitor RPA processes and RPA bots. But what if you want statistics for all RPA processes running in your organization? This is when you need to use the Dashboard module.
Get to Know the Dashboard Module
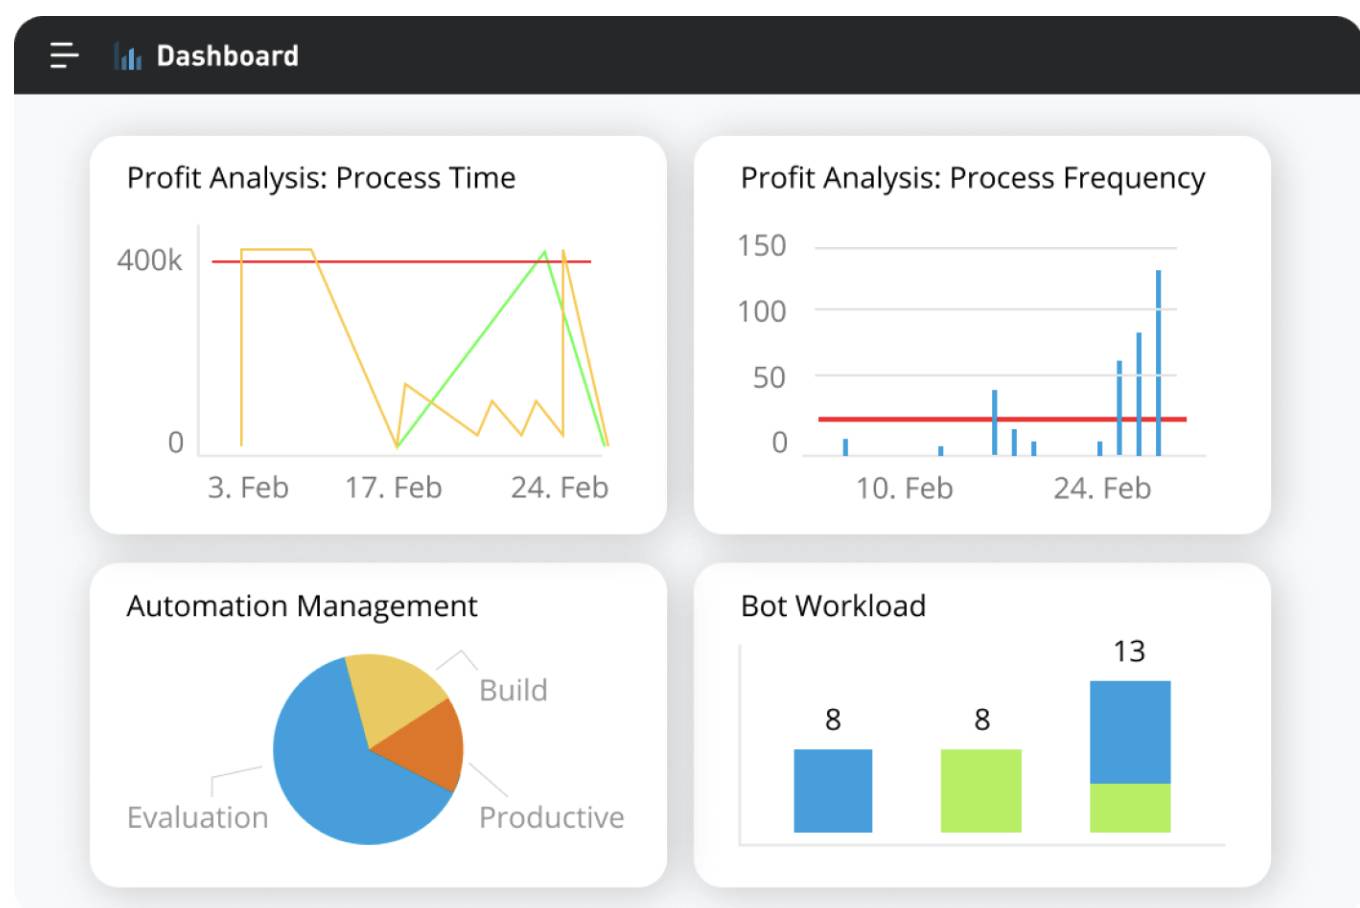
The Dashboard module in MuleSoft RPA Manager allows you to see key metrics for all RPA processes in a single view.

Use Dashboard Widgets
You can create various dashboards to organize one or more Dashboard widgets.

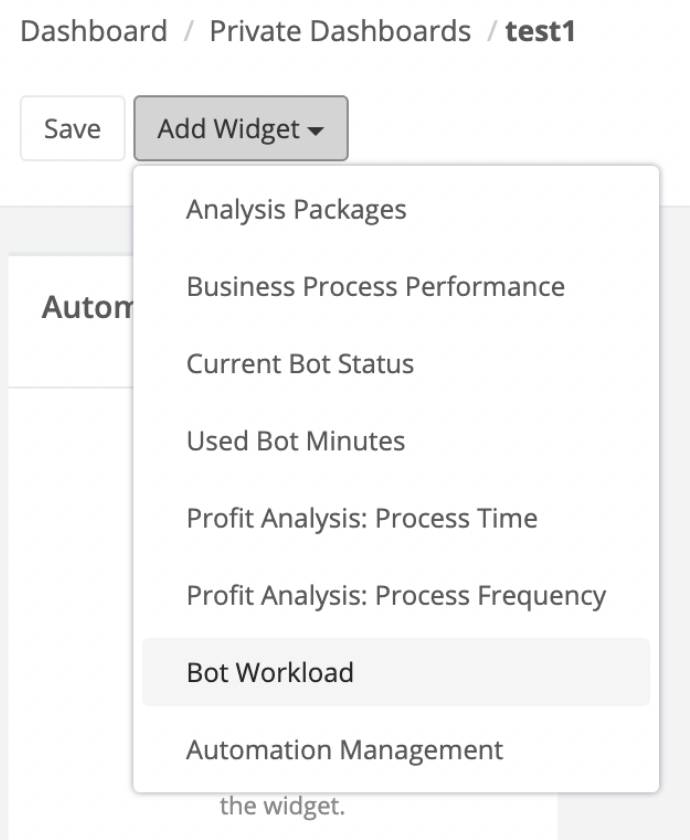
Mulesoft RPA Manager provides the following widgets for creating dashboards.
Widget Name |
Description |
|---|---|
Analysis Packages |
Shows number of analysis packages for all RPA bots collected during analysis intervals. |
Business Process Performance |
Shows how often the process is triggered within the analysis interval and average execution time. |
Current Bot Status |
Shows status of RPA bots. |
Used Bot Minutes |
Shows how many minutes all bots have used in the selected time interval. |
Profit analysis: process time |
Shows process execution time per production configuration compared to manual process execution time. |
Profit analysis: process frequency |
Shows process execution frequency within analysis interval. |
Bot Workload |
Shows RPA bot session allocation per production configuration. Also shows free sessions. |
Automation Management |
Shows progress of all RPA processes in terms of lifecycle phases. |
Use Public Dashboards
Dashboards created and published by users in your organization are listed as public dashboards. Only users assigned the Dashboard Open privilege can view dashboards.

The following information is shown for each public dashboard.
Public Dashboard Item |
Description |
|---|---|
Name |
Shows name of dashboard. |
Description |
Shows brief description of dashboard. |
Analysis interval |
Shows time period for evaluated data. |
Refresh rate |
Shows time period after dashboard is refreshed. |
Last change |
Shows timestamp when dashboard view was last updated. |
You can also edit, copy, delete, and save a dashboard. Click Save to make a private copy of the public dashboard.
Walkthrough
Take a look at this video demonstration showing how these tasks are performed by an administrator. If you wish to follow along with text instructions, check out the walkthrough instructions.