Set Up Metrics
Learning Objectives
After completing this unit, you’ll be able to:
- Create summary calculations for metrics.
- Show rule and statement metrics.
- Add custom metrics to a statement.
Create a Summary Calculation for Metrics
It’s helpful for reps to see the payout rate they’ve earned in a period. To show this data, you need a summary or worksheet calculation. Return to the worksheet you created in the previous unit, TierPayoutRule_Worksheet, and create a summary calculation using the tier_payout function. Remember to format the worksheet calculation to percent, which is done from the settings menu on the right.

In the next section, find out how you can show this data through metric cards and display columns.
Show Rule Metrics
To see the result of the tier payout rule on a rep statement, navigate to the rep statement and click  . You’ll see the rule appear as one of the rule cards. With the commission rate calculation created both as a calculated field (datasheet calculation) and summary (worksheet) calculation, you can add that data to the statement in two different ways. You can add it as a metric card or a display column.
To add either a metric card, or a display column, the first step is to go to a rep statement. Once on an individual statement:
- Click Edit in the top right-hand corner.
- Under the payout rule that you are working on, click Edit Metrics.
- Toggle on the worksheet calculation, or calculations, you want to show.
- Click Apply.
- The calculation shows up in the Key Metrics section of the payout rule for every rep on that plan. When your statement is set up to your liking, click Done Editing.


Here’s an example statement with both a metric card and a display column providing the rep with the earned rate in the period.

Show Statement Metrics
The worksheet calculation you created for your plan can also be used as a statement metric card. Navigate to a rep statement and click Edit. After clicking + Add Tile in Edit mode, select Custom and type in the name of the calculation.
If multiple calculations share the same name, the API name of the calculation will appear in parentheses next to the name. If the metric is formatted as a percentage, Spiff can represent it as a single value or a progress ring. All other numerical data is limited to a single value.
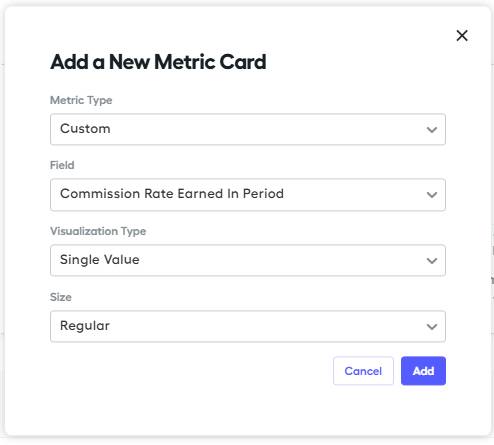
Metrics can be displayed in a regular or compact size. Compact metrics can fit two cards in the size of one regular metric square. Percentage ring visualizations can only be displayed in the regular size.
Click Add to show the metric card. If you’ve chosen a metric that wasn't used in the commission logic for your plan, it won't show any data until the statement is recalculated, and your web browser is refreshed. If it doesn’t happen after a refresh, don’t panic! Your statement might just need a few minutes to recalculate before you refresh.
Add Custom Metrics
What if you want to add metrics to the statement that help motivate your reps, or provide more transparency of the commission plan? Reps like having greater visibility into how much ARR they need to close before hitting their next tier of accelerators. Here’s one way to build that metric.
- Add a column to your existing range table that calculates accelerators, and name it
BottomOfNextTier. You can also build a new range table for this though.
- Enter the values into this new column. For the example we’ve been using, Tier 1 would have 150,000 as the BottomOfNextTier and Tier 2 would have 250,000 as the BottomOfNextTier.
- Create a worksheet calculation and name it
ARRToNextTier. - Navigate to a rep’s statement and add the ARRToNextTier metric.
Here’s the logic of our example:
=tier_payout(TotalARRInPeriod, TierPayoutAcceleratorTable, false, “BottomOfNextTier”) - TotalARRInPeriod.
To avoid errors if the rep has maxed out their tiers, wrap part of the formula with an if function that returns 0 in situations like these, rather than a negative ARR value: =if(TotalARRInPeriod >= 250000, 0, tier_payout(TotalARRInPeriod, TierPayoutAcceleratorTable, false, “BottomOfNextTier”) - TotalARRInPeriod)
Now that you’ve completed this module, you understand how to create and apply tier payout rules. And you can create any statement metrics you like with worksheet calculations. It’s time to get started setting some up for your organization.